
There’s a thousand ways to determine the entry level on a trade…
People use all kinds of technical analysis, scanners and algorithms etc. to figure out which stocks to buy and for how much.
You can either learn to do it all yourself, or you can pay to have a lot of it done for you.
And honestly, if you can afford a tool that does that, why wouldn’t you?

A scanner that saves you time you would have spent looking at charts instead of trading is a big win.
Even just 15 minutes saved each morning adds up to over 60 hours a year that you could have been spending on more important things.
But whether you’re doing it manually or with the help of technology, getting in at the right price is only half the battle…
The real skill (and the one that gets you paid) is nailing the exit.
The best way to build that incredibly important skill (besides trial and error) is to watch someone doing it live.
And that’s exactly what I do with my students every week on my live webinars.
Let me show you the strategies I use to plan my exits.
Walking Through a Live Exit
Wetour Robotics Limited (NASDAQ: WETO) opened at $7.21 on Monday the 31st.
By 10:58 that morning it was trading for $14.00. (nearly double its open in under 2 hours)
WETO had a lot going for it…
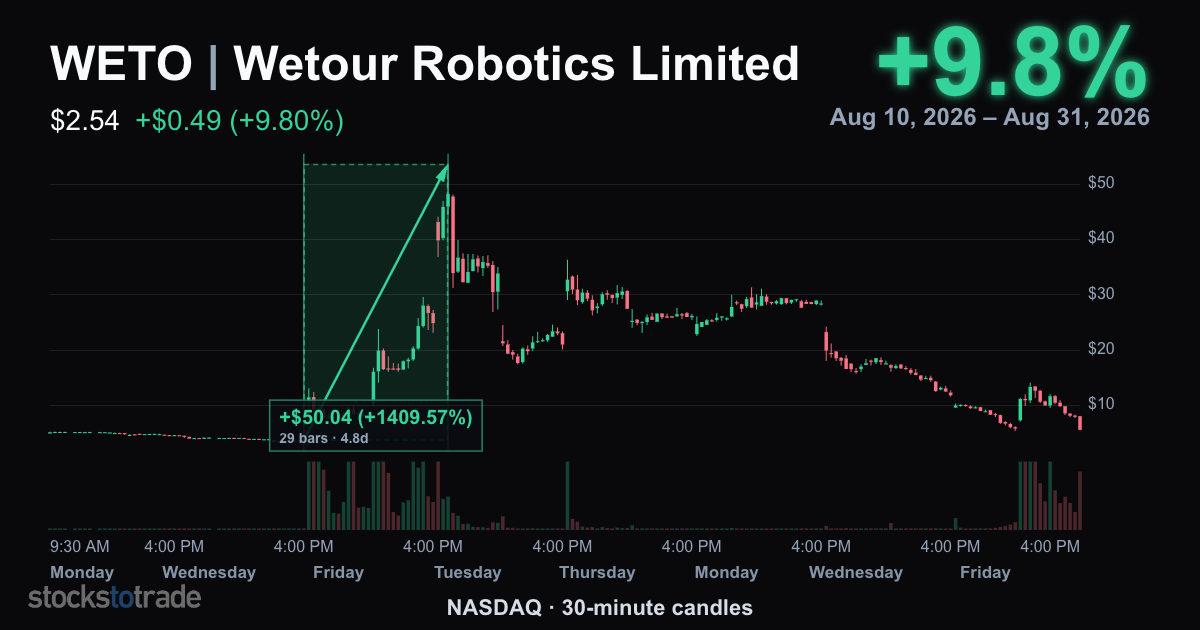
- Former runner, one of the biggest in all of August
- Proven bounce, it had come back before after selling off hard
- Coming off a hard flush, down about 80% in 3 sessions
I had it up on my screen when a student announced in the chat that they had bought WETO at $7.30 in the first few minutes.
They bought the breakout, so their stop sat just under the price it broke out from.
Their risk was about $0.30. The upside was easily $3-4 if the bounce ran. But nailing the trade means nailing the exit.
You don’t actually make any money until you’ve exited the trade. And selling near the top (without holding on too long) is a challenge for any trader.
3 Signals That a Run Has Topped
At one point my student asked me “Is this pullback the top of the run, or just another blip on the way up?”
When you’re sitting in a trade, that can be one of the most difficult questions to answer.
There are 3 signals I look for when when a running stock pulls back:
- A hard slam down off the high it just made
- A bounce that fails to get back up to that high
- A slide below where the first slam stopped
If all 3 happen, that’s a strong signal that the stock has likely just topped.
By 10:58 WETO had done all 3…
- It ran all the way to $11.41, then slammed straight back to $10.30.
- Then it bounced to $10.71, well short of that $11.41 high.
- Finally, it slid back through $10.30 and broke $10.00
If you sold at that $10.00 level thinking $11.41 was the top of the run, that exit would have put you up about 37% from the $7.30 entry. (That’s a good day for anyone)
But there’s no perfect formula to predict the absolute top of any run. WETO actually recovered after breaking through that $10.00 level and ran for another $4.00 above that
So that first pull back that happened at $11.41 was a fake-out, and selling it cost you about $4.00 of upside
But an hour later, at $14.00, the same 3 signals showed up again.
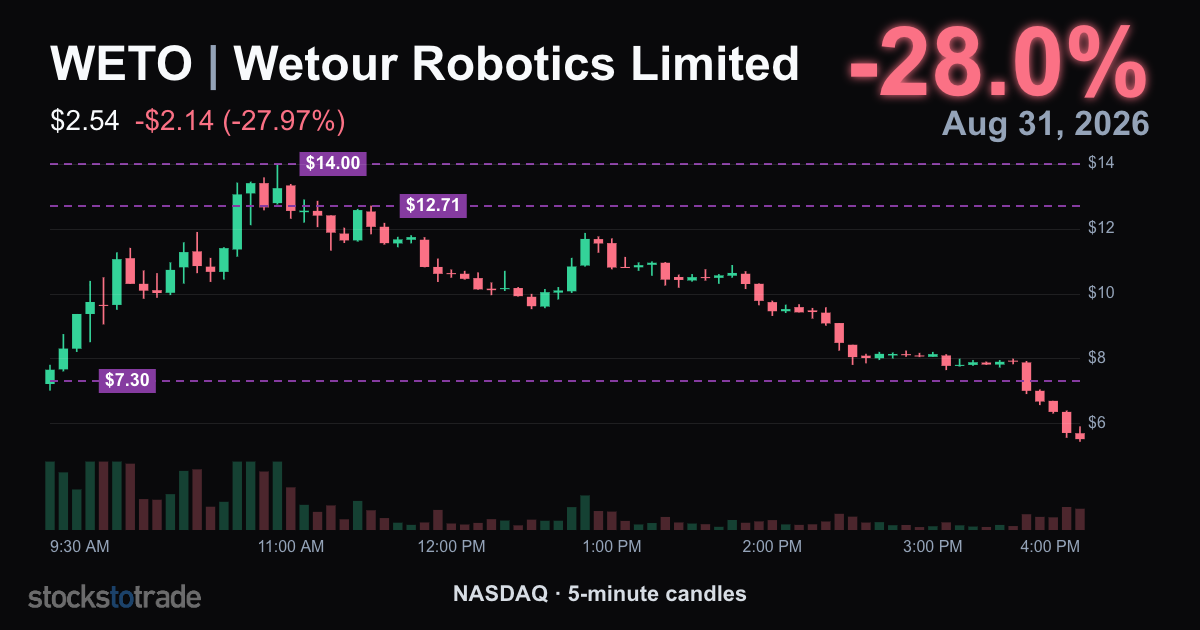
This time the bounce stopped at $12.71 and the stock never saw that price again.
That turned out to be the signal we had seen the real top, and WETO closed that day at $5.48. (Well under its $7.21 open).
No formula can predict the top every time. Some days it fakes you out, you sell early, and you bank a good gain instead of a great one.
Some days there’s no false alarm at all and the first signal you get is the real one.
The bigger risk is watching that entire run bleed out into the close and leave you with a red trade.
If you want access to more strategies like these,
Sign up here.
Stay sharp,
Jack Kellogg
*Past performance does not indicate future results.