I put out a watchlist before the bell on Monday and one name blasted over 95% by the close. I had the whole trade plan published ahead of time…
The plan was thorough, but on Monday you only needed one number to make that trade.
When a stock hits your buy target and blasts for the rest of the day…it’s hard to mess that up.

But not every trade is that simple. And if you’re counting on those easy wins to grow your account…good luck.
If you want a chance at nailing more than just one lay-up every month, you need to build proper trade plans ahead of time.
I need a plan for every name so I don’t have to make split judgement calls when money is on the line.
That means multiple levels, each one telling me exactly what to do at any point during a stock’s move.
Not every name gets the same type of plan. Some charts give you more to work with than others. But figuring out as much as you can ahead of time is the name of the game.
If you’re just setting buy and sell prices and calling it a plan, you are relying on mostly luck.
Let me walk you through how I build trade plans for the names on my watchlists.
The FTFT Trade Plan
I published 4 levels for Future FinTech Group Inc. (NASDAQ: FTFT) on Monday.
$3.55 – The buy price. That was the high on September 9, and the stock ran into it and got knocked back down. If it takes that price out again, I’m long.
$3.40 – The alert price. This was the high from Friday’s session, where it got knocked down a second time. If the stock climbs over $3.40 I stop looking at anything else and watch, because my buy is sitting right above it.
$3.00 – This is my level to keep my interest. As long as it holds that, I keep expecting my buy to show up and I pull the chart up every morning.
$2.80 – $2.80 is where I stop waiting. It comes off the watchlist and I’m not looking at it tomorrow.
On Monday, my buy was the only one of the 4 that ever came into play…
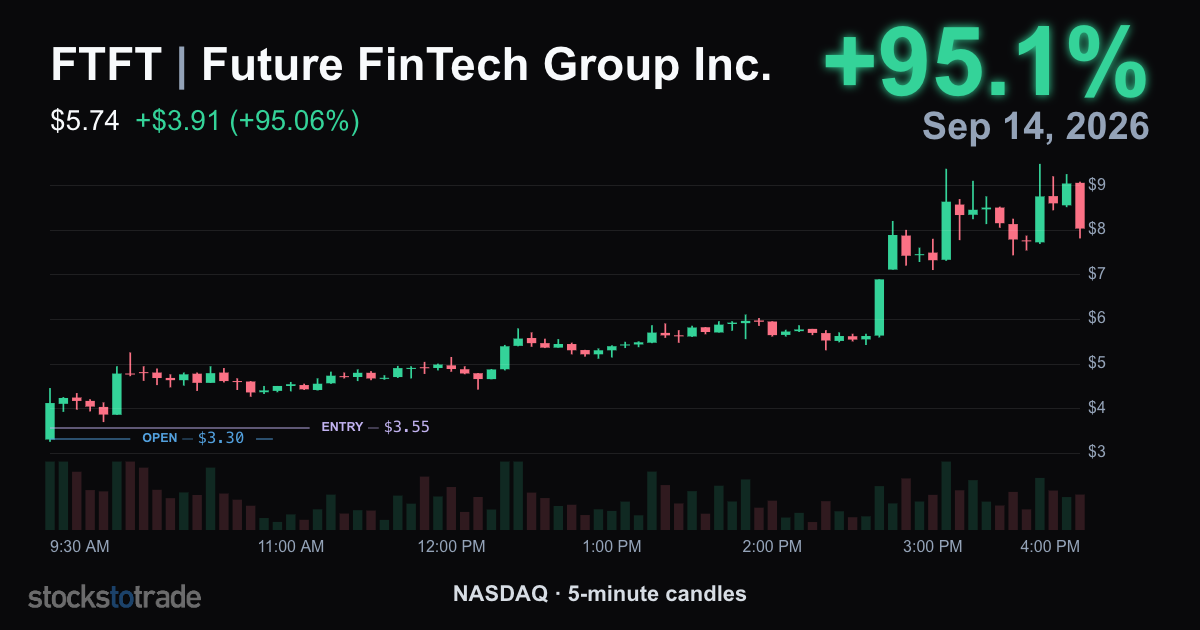
FTFT opened under $3.55 and cleared it in the first minute. Outside of one minute right after that, it never traded under that price again.

Okay that was easy.
But it’s not always like that.
TRUG was another name I was in that morning.
I had already figured out a stop, and where I was hoping to take gains…
$0.65 was my entry.
I gave myself a $0.05 stop loss. (If it can’t hold $0.60, I’m out.)
If it runs, I’m taking gains from $0.80 up to $1.00.
Just like with FTFT, only one level mattered on Monday morning. My $0.60 stop had me out of the trade before 10:00 am.
The stock recovered but still closed under my $0.65 entry.
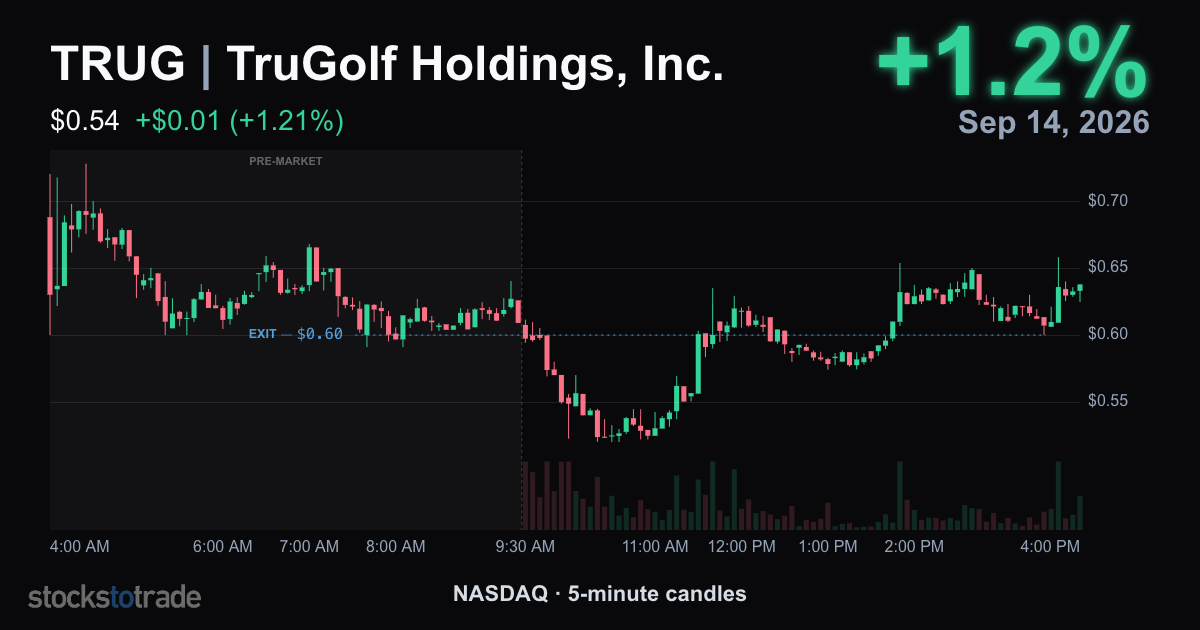
$0.60 broke in pre-market, which is right where people start negotiating with themselves. It’s early. There’s barely any volume. It’ll come back by the open.
$0.60 was written down as the price I’m out, so I was out.
It broke again right after the open. By mid-morning the stock was 20% under where I bought it.
Without that one line I’m sitting through a 20% drawdown to finish the day right back where I started.
IBRX is the third one, and it’s the one still hanging over this week. It’s been choppy and annoying, so I asked more of it before I’d put money down.
If it closes over $8.50, I’m long.
If I get that, I think it can run to $10 or $12.
If it loses $7.00, it’s off my watchlist.
Monday it traded above $8.50 late in the afternoon and still closed underneath it. A touch doesn’t count, and on a stock that chops around like this one it never did.
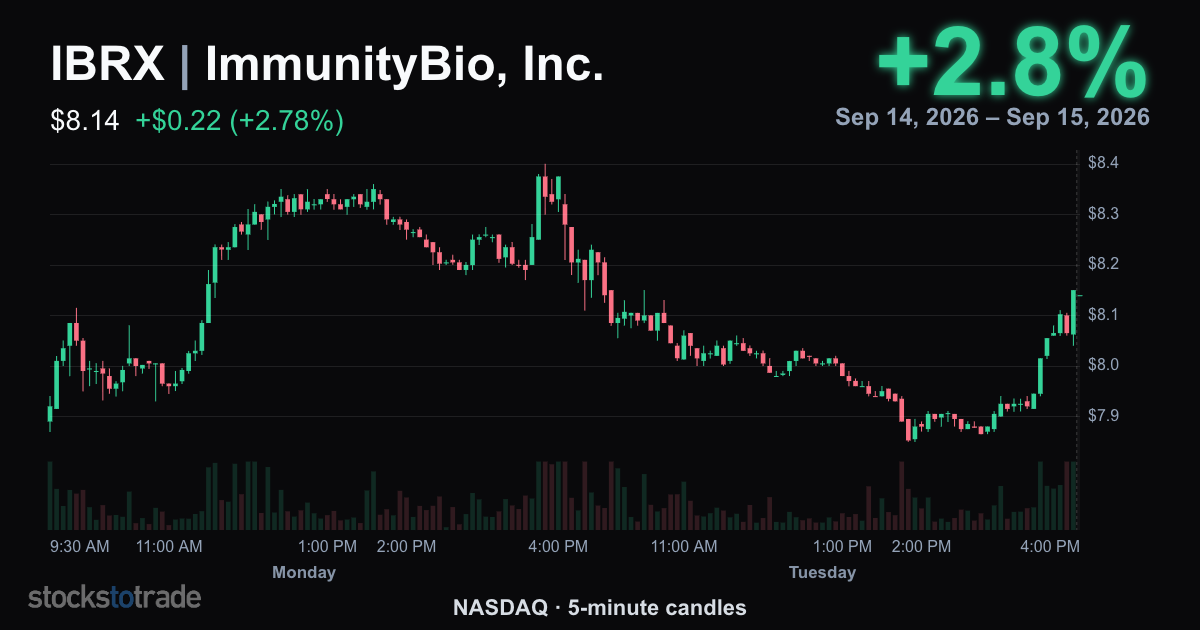
So I don’t own it, and it goes into the back half of the week with the same plan sitting on it.
Every week I build plans on the names I’m watching. Finding the levels from the charts is a skill you can learn. It’s not rocket science (it’s technical analysis).
My mentor and expert Trader Tim Sykes has been teaching students how to do this properly for years.
He’s hosting a FREE live event TONIGHT.
Make sure you don’t miss it.
Stay Sharp,
Jack Kellogg
*Past performance does not indicate future results