Hey, Traders,
I didn’t start off as some trading prodigy.
I blew up small accounts and chased hype, taking way too many trades just to feel “busy.”
None of it worked.
What finally clicked for me wasn’t a magic setup or some secret indicator.
It was learning to slow down … and get laser-focused on only the best opportunities.
The big shift came when I started thinking long-term and focusing on high reward with low risk.
That’s the heart of my Seven-Figure Cycle strategy.
This approach is about being selective by waiting for the best setups.
I use tools that help me read price action clearly, and I manage risk like it’s my job — because it is.
Let’s break down the core ideas I use before I ever place a trade.
Step 1: Look for Relative Volume
The first thing I always check is relative volume.
This shows how much volume is trading today compared to normal.
If a stock usually trades 500,000 shares a day and suddenly it’s at 5 million before noon, that’s a huge spike — and a clue that something’s going on:
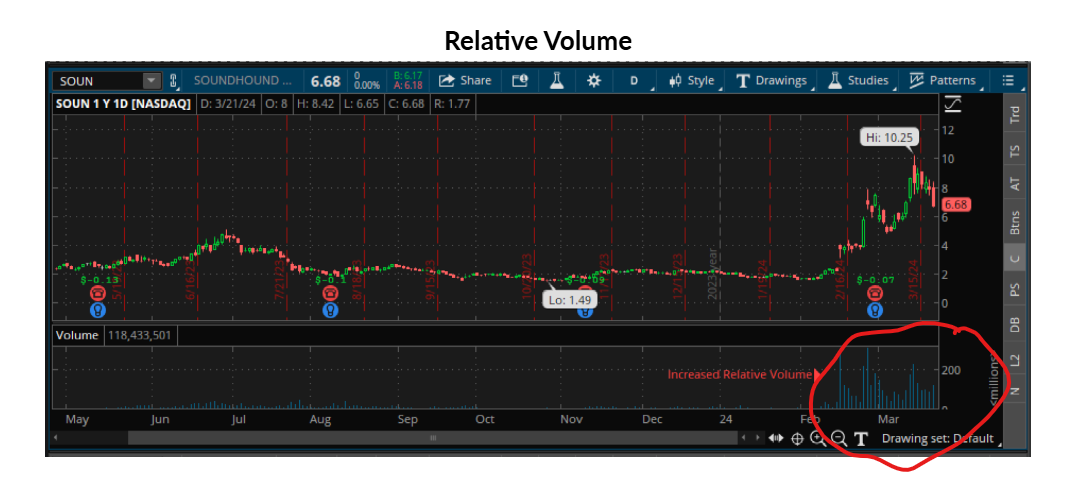
Volume is like fuel.
Without it, price moves can’t hold.
But when there’s high relative volume, it tells me more traders are interested.
That means opportunity.
I don’t just care about the price going up. I want to see volume growing with the move.
That’s what gives it power and follow-through.
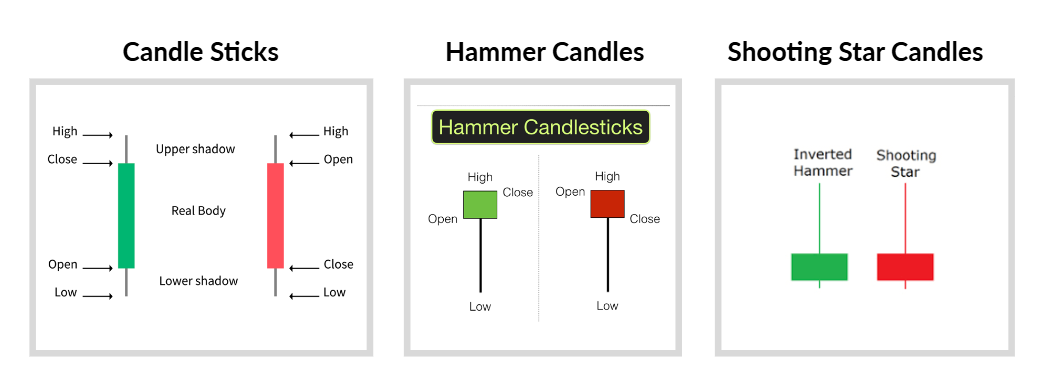
Step 2: Read the Candlestick Charts
Price action tells the story of every stock, and candlesticks help me read that story fast.
Each candle shows four key things: the open, the close, the high, and the low for a given period.
It might be one minute, five minutes, or daily, depending on the chart I’m looking at.
Certain candles can give strong clues about what buyers and sellers are doing.
▶ ️ Hammer candles have a small body and a long wick on the bottom. This means sellers pushed the stock down, but buyers came in and bought it back up. It’s a sign of strength. I like seeing these after a dip, especially near support.
▶ ️ Shooting star candles are the opposite. They have a small body near the bottom and a long upper wick. That shows the stock ran up but got slammed back down — sellers took control. It’s usually a warning sign, especially near resistance or after a big run.
I don’t trade off one candle alone.
But when these patterns line up with volume and key levels, I really start to get interested.
Step 3: Wait for the Right Breakout
This is where I make most of my gains.
A breakout is when a stock moves above a key resistance level.
That level could be the high from a previous day, week, or even month.
Once it breaks, it can trigger a lot of buying, especially from traders who have been waiting for that move.
Here’s how I look at these:
▶ Multi-day breakouts: A stock pushes past recent daily highs. These can be fast-moving and good for quick trades, but they don’t always hold.

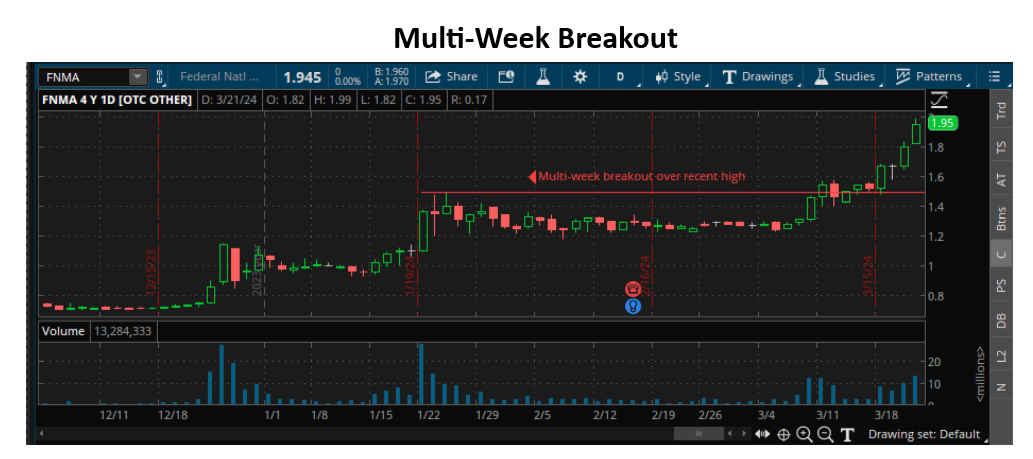
▶ Multi-week breakouts: These show stronger conviction. If a stock breaks through a level it hasn’t touched in a few weeks, that tells me it’s gaining attention.
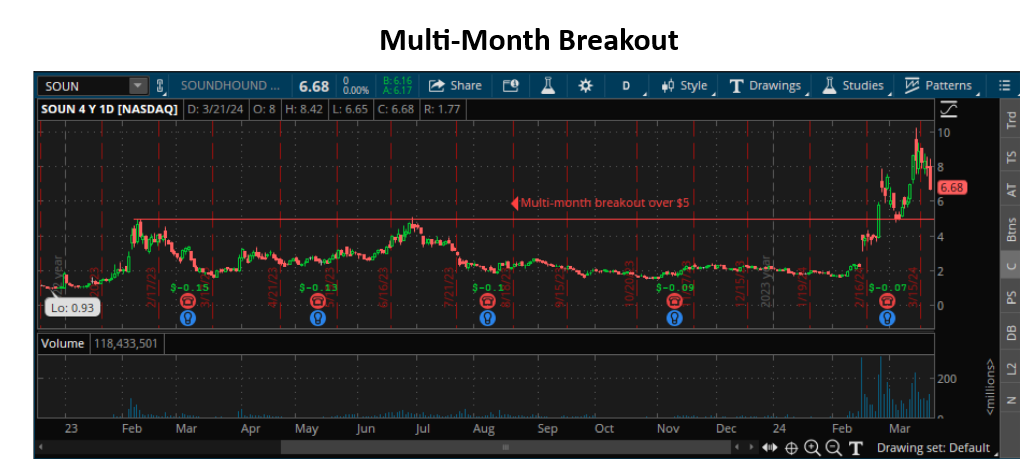
▶ Multi-month breakouts: These are the best setups. When a stock breaks out of a range it’s been stuck in for months, it usually means something major has changed such as news, sentiment, or just a trend shift. These are the ones where I’m willing to size i
The key is to wait for confirmation.
I want to see the stock break out, hold above that level, and ideally pull back a little — so I can enter with tight risk.
My goal is to risk maybe one to make three, five, or even 10. That’s the math that keeps me in the game.
Why This Works
I’m not trying to trade everything that moves.
I’m only looking for the best risk/reward setups.
I want to be early in the cycle, when volume is building, patterns are clean, and breakouts are just starting.
That’s where the big wins happen.
In Part 2, I’ll dive into the tools and tactics I use once I’ve found a good setup.
If you want to level up, don’t miss it.
And if you want to level up even more, become a member and learn to grow your account like I have.
— Jack