Hey traders,
Most traders think a watchlist is just a list of tickers.
Names that moved yesterday. Names they saw on social. Names that feel “hot.”
But a good watchlist isn’t just about movement, it’s about structure.
A-level setups. Patterns with potential. Stocks that meet a specific set of criteria.
Because you’re not just watching to watch… you’re watching to strike.
The list I’m tracking going into next week is full of different tickers, sure, but they all share similar DNA: Float rotation. Volume strength. Breakout structures. Clear levels forming.
That’s what makes a setup worth watching. Not hype, but pattern pressure.
The kind that builds quietly, then explodes fast when the moment comes.
And when those patterns show up under the right market conditions, you get moves that can change your whole week.
We’ll break that down today:
- What these tickers have in common.
- Why I’m watching them.
- And what makes a chart worth your focus in the first place.
Because when your watchlist is built on logic, not noise, you start seeing trades before they happen.
This week, a few names jumped out at me. Some have been heating up quietly for a while. Others just started making noise. Either way, I want to walk you through why I’m watching them, and more importantly, what they have in common.
Because if you can understand why these stocks made the cut, it gets way easier to start spotting these kinds of setups on your own.
New Era Energy & Digital, Inc. (NASDAQ: NUAI)
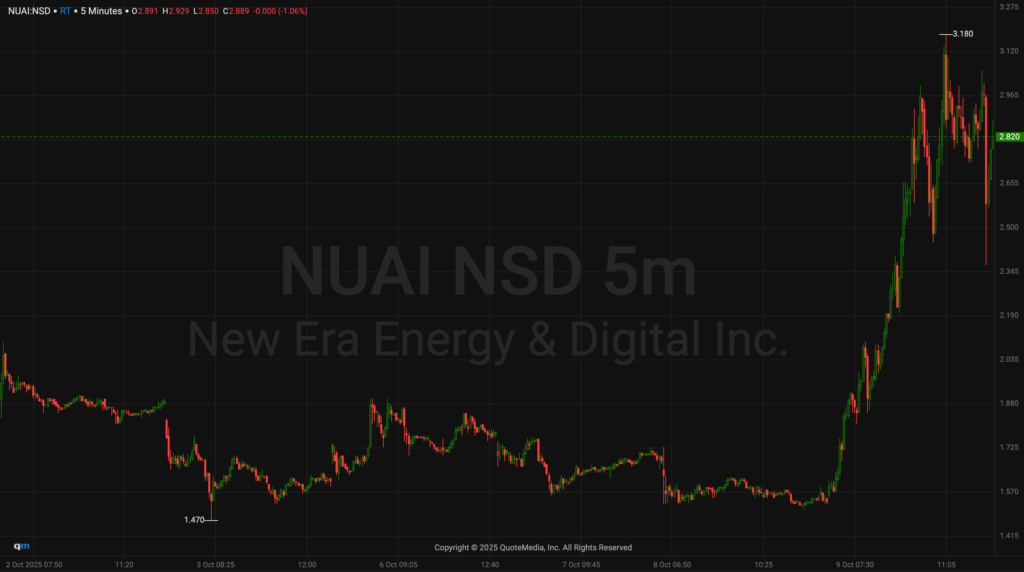
NUAI first hit my radar through the Power Signal Indicator and caught fire ripping from around $1.50 per share to a high of $3.18 in just a few hours.
That’s an 81% intraday move with 165M+ shares traded, which is nearly 10x its average daily volume.
It broke out of a tight consolidation range and didn’t look back, with clean trend and strong demand into the close.
The float’s just 11.35M, and the price action came after a string of red days, which likely trapped shorts.
This is the type of move I look for: low float, volume surge, clear daily breakout, and a stock that’s showing it can actually hold levels.
I’ll keep watching to see if it can hold above $2.50 and start forming a base around that breakout zone.
AiRWA Inc. (NASDAQ: YYAI)
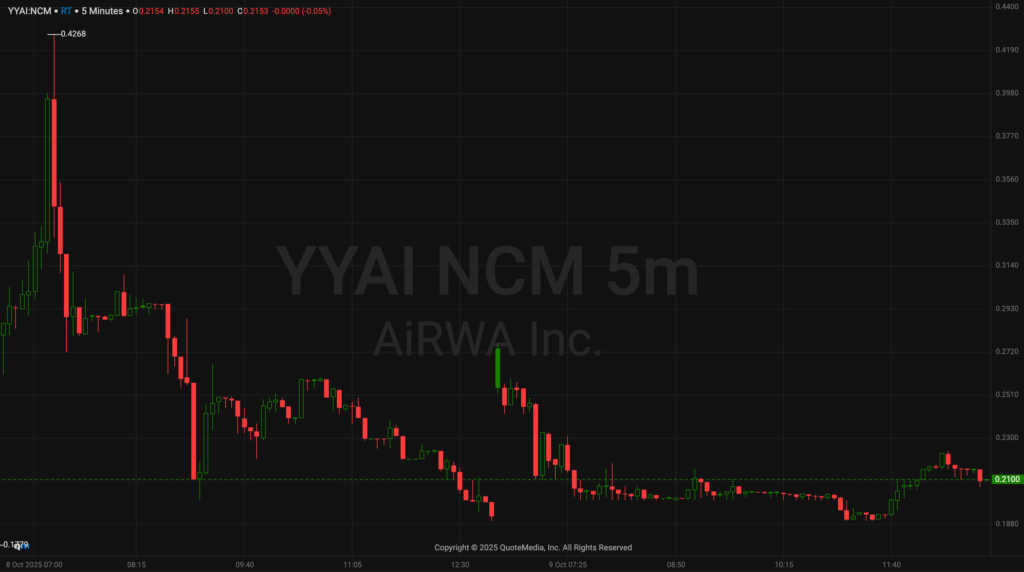
YYAI gave us one of the wilder moves this past week. It spiked to $0.42 early in the session, then faded hard back under $0.20 by the end of the day. That’s a massive range, and it traded nearly 800M shares on the day.
The float is relatively small (~6.4M), and while the stock closed weak, this is one to keep on radar for potential bounce setups or red-to-green moves, especially if the speculative AI hype cycle continues.
It’s not one to chase blindly, but with the right setup, it’s the kind of former runner that can move fast when it picks up again.
EPWK Holdings Ltd. (NASDAQ: EPWK)
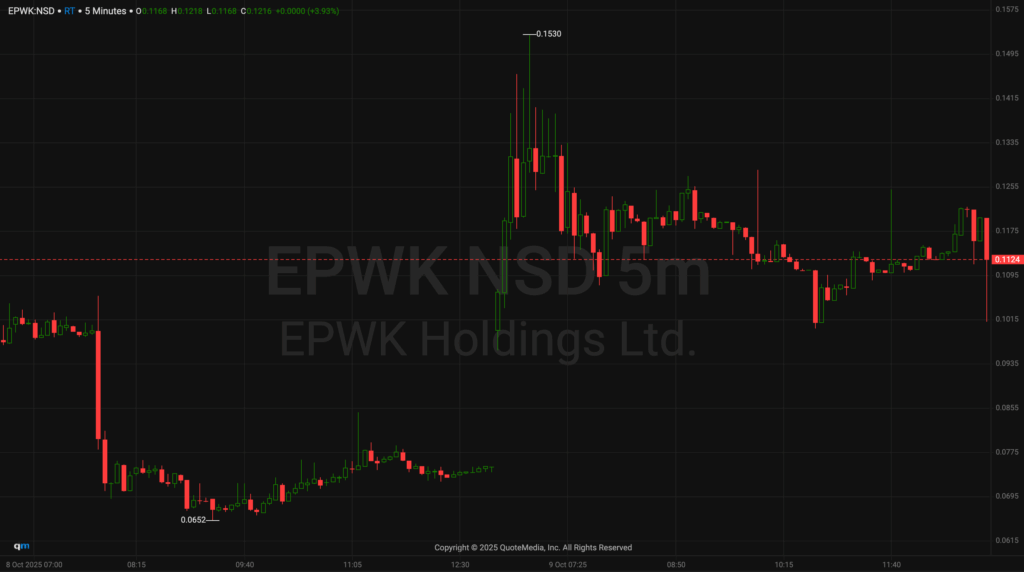
Most traders probably ignore this one, but it pulled a full reversal, dipping hard early, bottomed out around $0.065, then exploded late morning to hit $0.153, more than a 135% move off the lows.
The stock traded 760M+ shares, compared to its usual 5M, so yeah, there’s something going on here.
It’s a low float (~9.5M) with a tiny market cap, and it clearly caught the right kind of speculative volume spike.
Why I’m watching it: Big volume behind a reversal like this can sometimes lead to day two continuation or even a longer breakout if it consolidates.
If it holds above $0.10 and volume comes back in, it could set up another trade.
AtlasClear Holdings, Inc. (NYSE: ATCH)
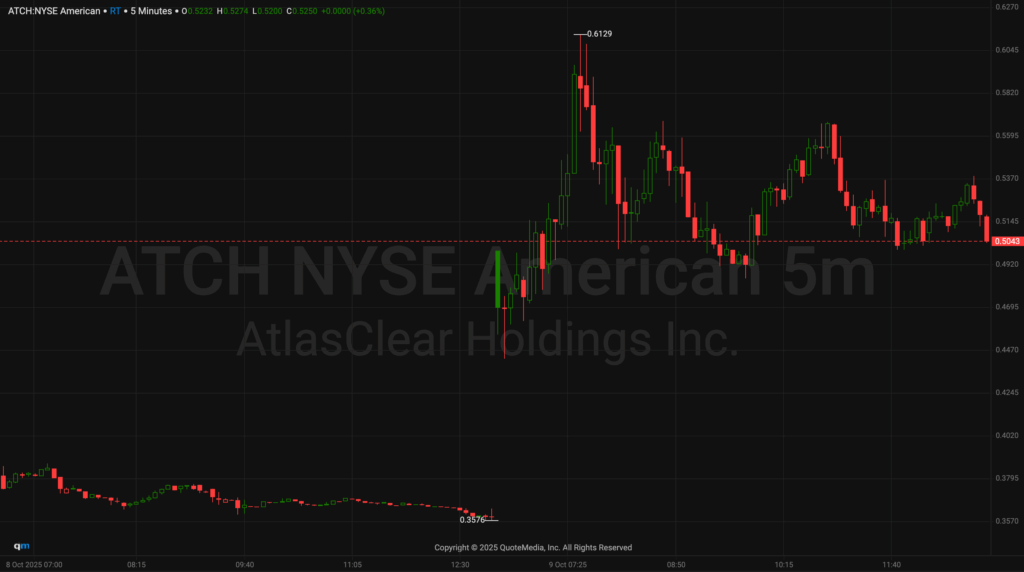
ATCH had a slow grind most of the week, then suddenly launched mid-day, going from around $0.36 per share to $0.61, a move of over 70%, before pulling back and settling around $0.50.
Volume jumped to 428M shares, which is nearly 8x the average, and the price action was relatively clean during that mid-day surge.
What’s interesting here is the large float (125M+ shares), which usually makes moves harder, but it still managed a strong spike.
It’s definitely more crowded than the others on this list, but it’s still worth watching. If it reclaims $0.55 with volume, we might see another push.
What They All Have in Common
None of these stocks are on my list by accident.
Each of these tickers spiked big recently. But more importantly, they shared some core traits:
- Low floats (aside from ATCH)
- Explosive volume, all traded significantly above average.
- Clean intraday setups, either strong breakouts or clear reversals
- Volatility, these aren’t stocks creeping up slowly, they’re ripping with power
But spotting them after they move is easy. The real edge is being able to recognize what they looked like before they broke out.
That’s why I don’t just watch “hot” stocks, I track behavior over days or weeks. I look at how they trade around key levels, how the volume builds, and whether they’ve got room to run.
This list isn’t just a group of alerts. It’s a study guide. If you want to start seeing these plays early, start studying these charts and asking: Where did the move start? What was the volume like before it took off? Were there clues in the pattern?
The more you do that, the more second nature it becomes.
That’s the kind of stuff I’m diving into at the live virtual event coming up later this month, The Road to $8M. It’s going down October 21–22, and Tim Sykes and I will be sharing our journeys along with a full roster of other traders, showing you:
- What these setups look like before they pop
- How I narrow my watchlist down every weekend
- And what I’ve learned after trading these kinds of stocks for years
You’ll hear from Tim Sykes and some of his top students, and you’ll see real trades, real setups, and the tools to build real confidence in your own trading process.
>> Click Here to Reserve Your Access While it’s Still FREE <<
If nothing else, you’ll leave with a better understanding of how to prep like a pro, and why that makes all the difference when the market opens.
Let’s get after it next week,
Jack Kellogg