Hey traders,
On March 1, I posted this on X…
Let’s be honest, predictions are… predictions.
But oftentimes, I have ‘gut feels’ that are correct.
So, I thought I’d lay out my case, a defense of my position, for my March.
It doesn’t mean I’m gonna be right (I mean, I only win 55.44% of the time).
Let that sink in. It’s important.
Like Tim Sykes says…
“If you win 50% of the time, and your average loss is smaller than your average gain, your account will grow.”
But if you want to grow your account the way I have, you need to focus on more than just the biggest % gainers every day.
Over time, you have to get a feel for the markets as a whole.
That includes Bitcoin, commodities like oil and precious metals, and even foreign markets.
I’m not saying trade those things. But understand what’s going on in the world and how it affects what YOU trade.
So, in defense of my X post…
I make my case.
PLUS… I’ll tell you HOW I would gain an edge IF I was starting over today
Let’s jump right in, guys…
Bitcoin Bounces to $80,000
It’s all about the technical indicators and the washout from the top in October.
On February 7, Bitcoin (BTC) bounced off its recent low of $59,800 per coin.
Since then, it has coiled in the $65,000 to $70,0000 range, with strong support around $62,800.
Let’s look at two indicators I use every day to see why I think it bounces…
First, the Moving Average Convergence Divergence (MACD).
In the chart below, each candle represents one day.
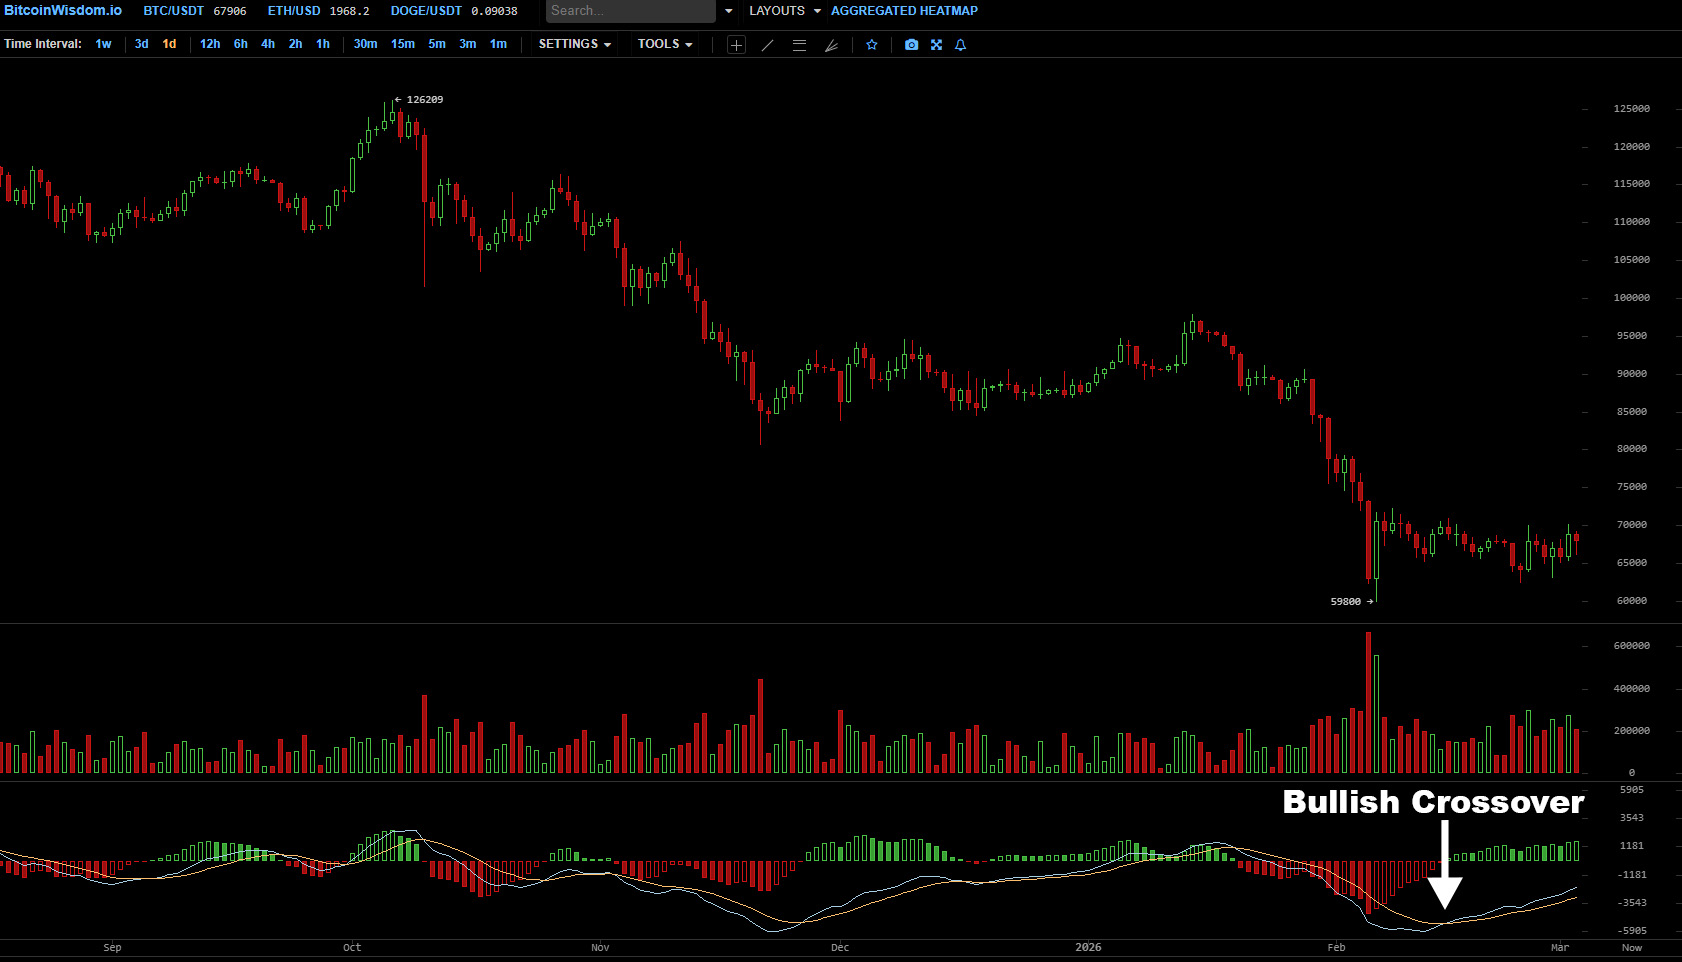
In a nutshell, the MACD shows the relationship between two exponential moving averages (I use it to gauge momentum).
The important part of the chart above is where the two indicator lines cross to signal a bullish crossover.
In other words, momentum shifted toward the bulls.
You should definitely study how the MACD works in more detail.
Now look at the BTC chart with the Relative Strength Index (RSI) at the bottom. Each candle represents one week.
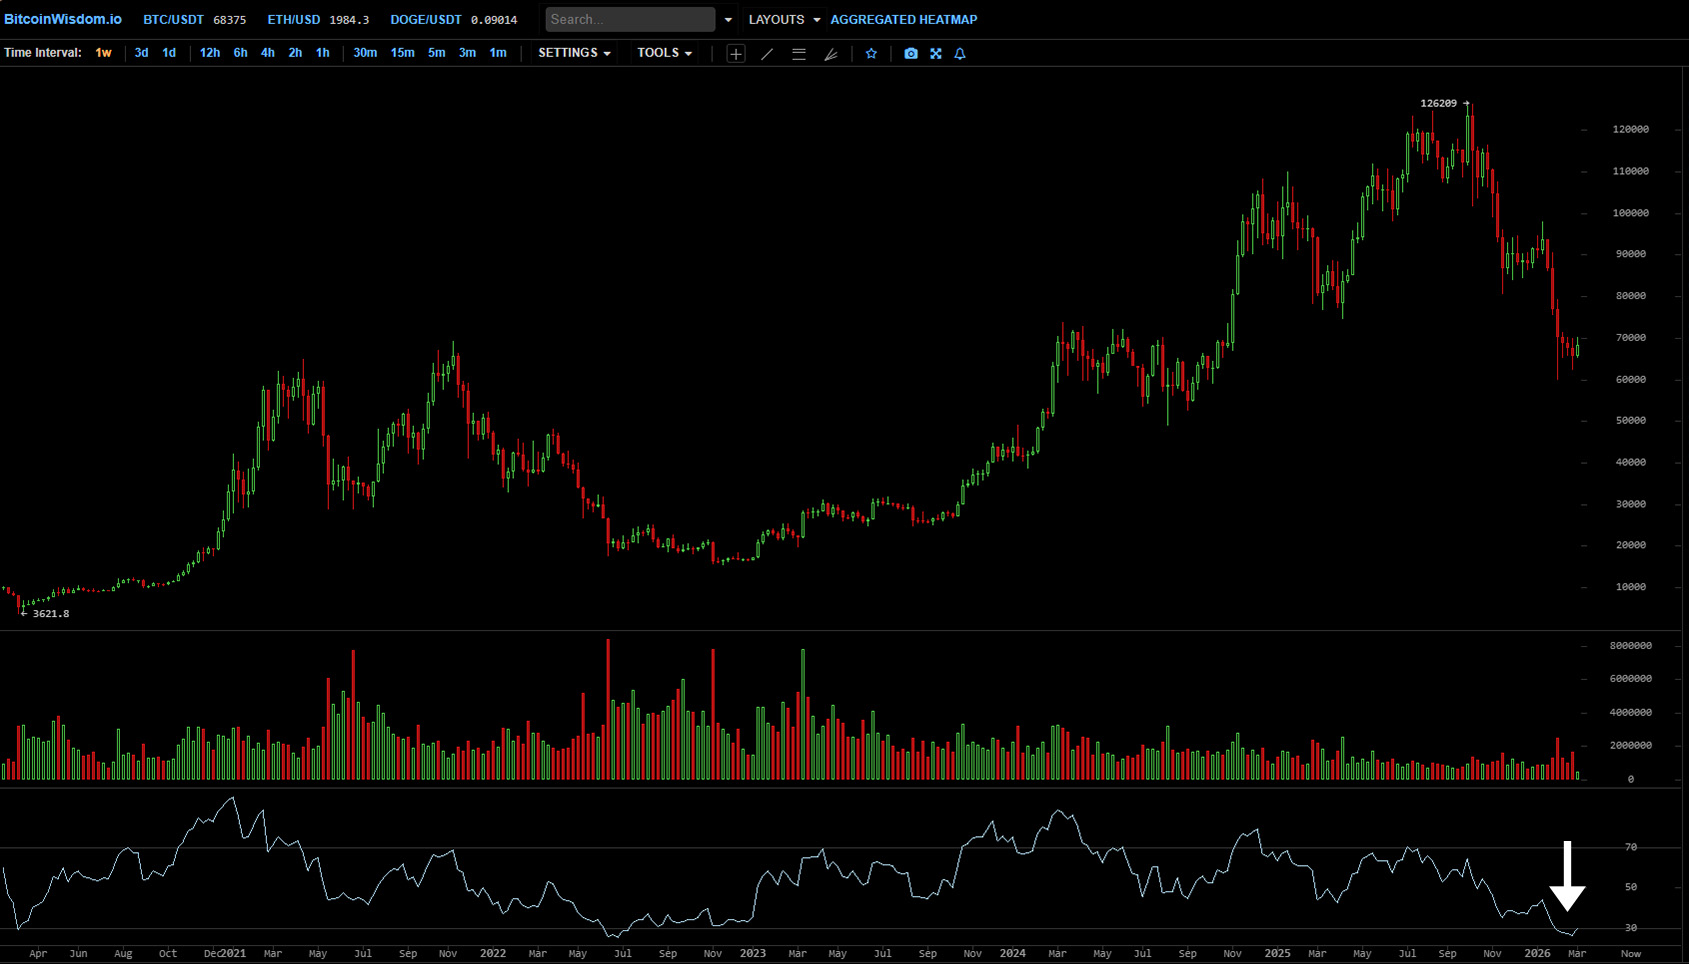
Look at the arrow on the chart, guys. That’s where the RSI dropped below 30.
If you trace back along the 30 RSI line, you’ll see BTC only dipped below 30 three times since late 2020.
RSI below 30 is an oversold signal. Considering how far BTC dropped from the October top, I predict the washout is over.
Time will tell. Next prediction…
Metals Don’t Make a Significant Move Higher or Lower
Gold, silver, and platinum skyrocketed in 2025 (and right through January) before a big pullback.
But I think they’ll go sideways this month.
Check out my case for…
- Gold: Monetary Policy Plays Tug-of-War. The market is pricing in rate cuts. At the same time, Producer Price Index (PPI) data says inflation is “sticky” (which means the Fed might not cut rates when it meets on March 16.)
- Silver: Investment Flows Compared to Industrial Demand. The demand for silver is high (so high it exceeds available supply). The law of supply and demand says that silver should trend up, right? But the high price means manufacturers find ways to use less (or recycle… or BOTH).
- Platinum: Priced Out by Palladium. Like gold and silver, platinum CRUSHED in 2025. What does that mean? Auto manufacturers are shifting back to palladium for catalytic converters (because it’s cheaper). So, even though there’s still high-tech demand for platinum, it’s balanced out by lower demand in the automotive industry.
One final thought, because this is what’s on everyone’s mind this week.
Precious metals surged in the runup to the Iran war (so the shock is already priced-in).
At the same time, nobody on Wall Street wants to sell off their gold hedge because the situation is tense.
All in all, I think it leads to sideways action in March (unless something BIG happens).
Next…
The QQQ Touches the 200 MA and Starts to Bid Up Every Day
First, check out the QQQ chart. Every candle represents 1-day…
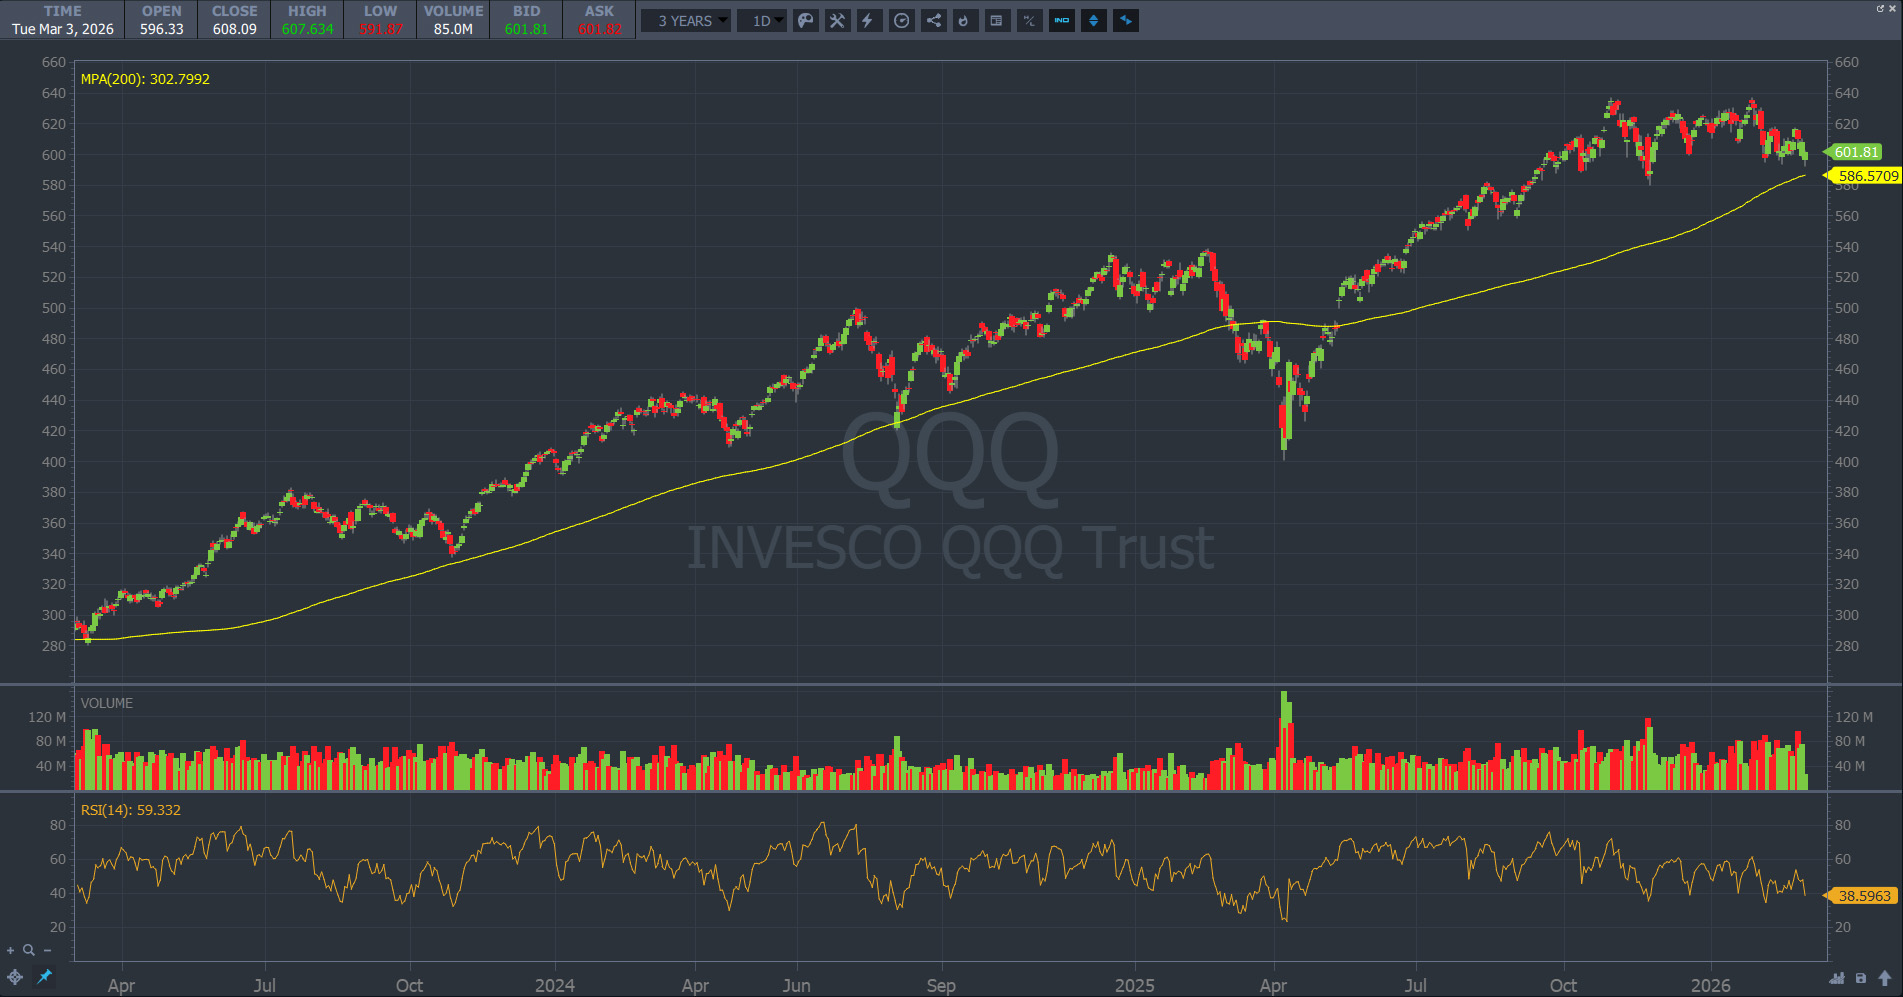
My prediction is based on three things.
- The QQQ Already Pulled Back. As you can see, it’s getting closer to the 200 MA by the day. Over the past three years, the QQQ only dipped below the 200 MA for roughly a month before it got hit with “Liberation Day” volatility. But even then it bounced when aggressive buyers were looking for discounts.
- The RSI Says “Oversold”. It’s around 38.5 now. Historically, anywhere from 30 to 40 RSI is oversold.
- The Big Picture. Think more investment in AI infrastructure, solid Q4 earnings, the Fed Easing cycle (see above because this one is up in the air), and seasonality.
And finally…
Small-Cap Energy Stocks Give Large Range Opportunities
Well, I got THAT one right already.
Guys, this is a trader service announcement…
War is a terrible thing. I’d rather not see this thing go on any longer than necessary.
But there’s one thing I’ve learned over the years. Global events present opportunities. This is no different.
With the Iran war, we’ve already seen some monster moves.
Your job as a trader is to take what the market gives you using all the tools and knowledge you have at your disposal.
Which brings me to what I would do today, if I were starting over…
First, I’d get my hands on EVERY tool we have available for you.
Then, I’d study (hard).
I’d gain experience and use every tool I had to gain an edge.
And that’s exactly what I did when I started.
Except for one BIG difference… we have SO many more tools available for you!
Like Tim Sykes’s XGPT. When he first released it, I said it “is the biggest breakthrough of Tim’s teaching career.”
I use it. Every single day the market is open.
And now, Tim’s done it again.
Check THIS out…
Today, beginning at 1:00PM, Tim says…
“My Supercharged AI could open up a whole NEW way of trading for you in 2026.”
Imagine seeing a forecast of a potentially massive move…
A day in advance.
And today at 1PM ET, you’re going to have a chance to see how he just clicks… prompts the AI… and watches.
Go get ‘em.
– Jack Kellogg