

Constantly watching stocks run without you can be exhausting.
This is my #1 tool for hunting setups.
Every green name with a big number on the board makes you feel like you missed something.
You’ve heard a thousand times not to chase. Over and over you’re told to take the meat of the move, not the bitter end.
But day 2 runners keep happening.

Sitting on your hands might seem smart. But missing every one of them is expensive too.
There’s a pattern I look for that sets up these second day runs.
And you don’t have to be lucky to find them.
The set up is easy to find if you know to look for.
The setup has 3 boxes for the stock to check at the end of day 1:
- The price breaks above a prior resistance level.
- During that same session, it sells back down below that level.
- It closes the session back above the level.
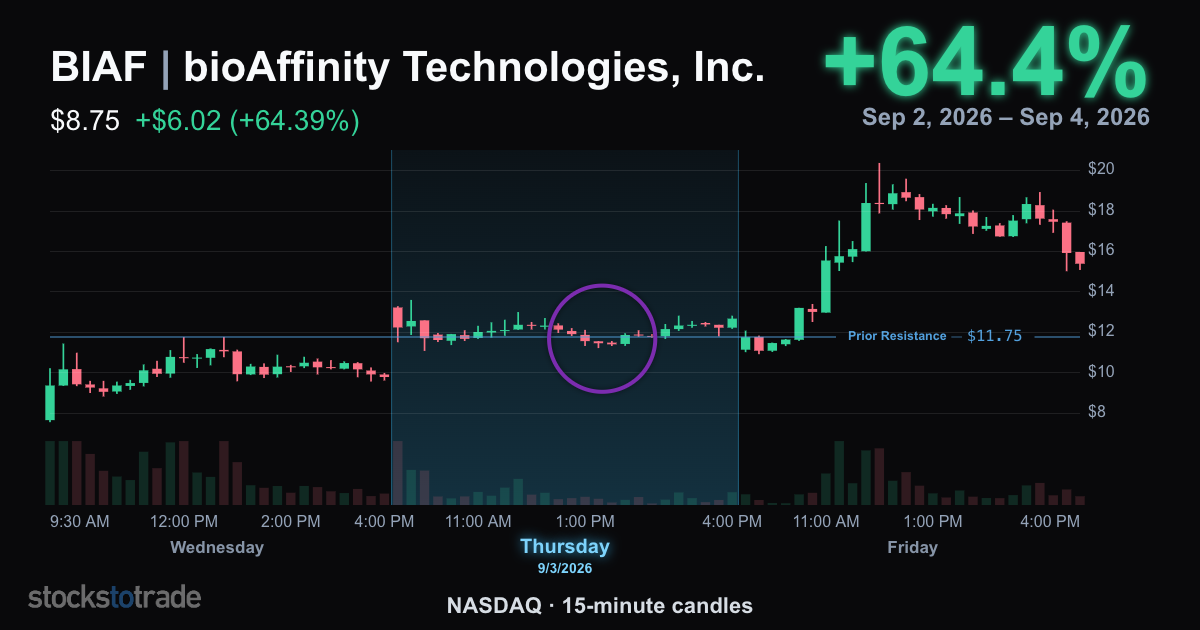
bioAffinity Technologies, Inc. (NASDAQ: BIAF) did all 3 on September 3.
BIAF had been rejected at $11.75 the day before. That set our resistance level.
The next day, BIAF opened at $13.20, well above $11.75. Once the stock broke through resistance, that same price flipped into support. A new floor for the day.
Part 1, check.
Then later in the session, BIAF sold off from a high of $13.58 all the way down to $11.06. It broke back below the $11.75 support level, hitting a low almost 18% off the high of the day.
Everybody who bought during the run got shaken out. They watched the stock dip back under the line that had just gone from resistance to support on everyone’s charts and sold, thinking the move was over.
Part 2, check.
Finally, BIAF closed at $12.78 that day, back above the $11.75 level.
Part 3, check.
All 3 boxes checked…
The Day 2 Trade
BIAF opened the next morning at $11.12. It ran to $20.35 and closed at $15.27. Open to close, the stock ran 37% on September 4.
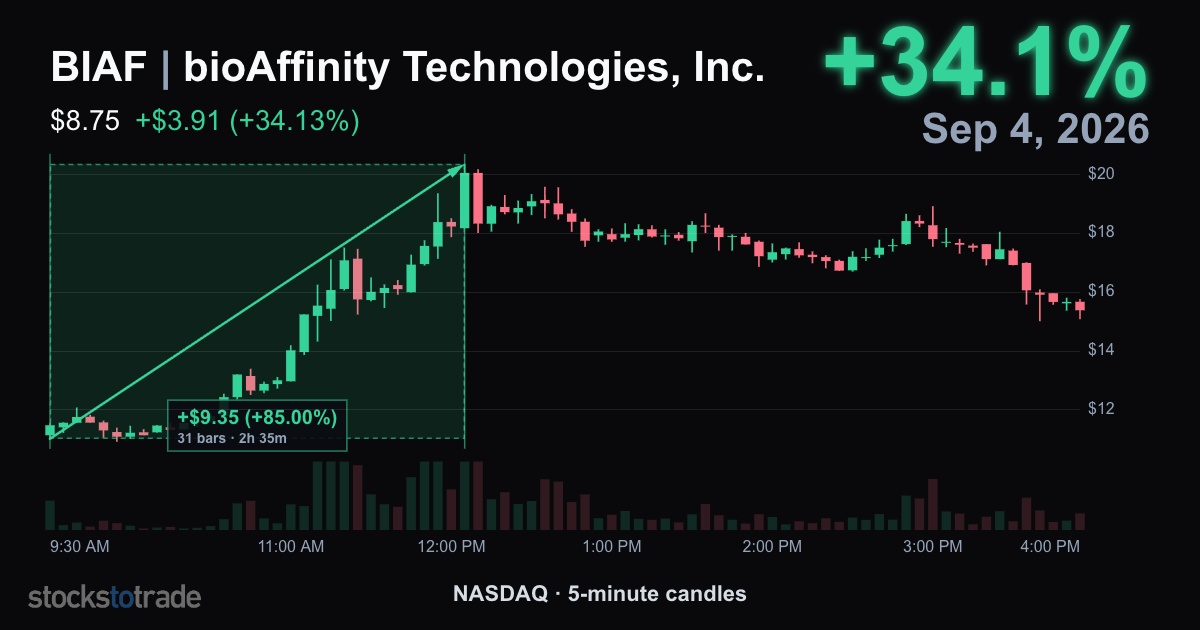
The traders who got shaken out during the September 3 dip watched the stock close above where they sold. Some of them bought it back the next morning at higher prices than they got out at.
Anyone who was short and got squeezed on the recovery came back in too. Their buying is what pushes day 2.
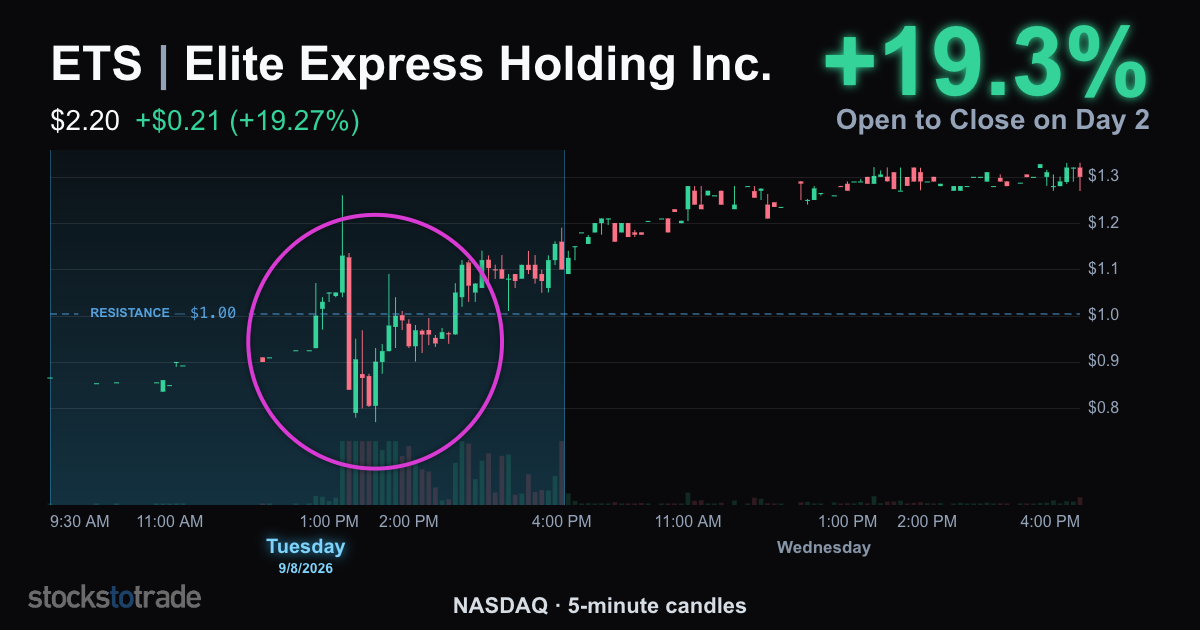
Elite Express Holding Inc. (NASDAQ: ETS) did the same thing on September 8.
That day ETS opened at $0.87 traded through a prior resistance level of $1.00 running all the way to $1.26.
Then it sold off hard, all the way down to $0.77, well below the level.
Plenty of traders who bought the breakout got shaken out on that drop. Then the stock recovered and closed at $1.12, back above $1.00.
The next day, September 9, ETS opened at $1.09 and closed at $1.29 (up over 18% open to close).
The stock has to close back above the level for this to work. If the selloff takes it below and it stays there through the close, the setup flips.
Everyone who bought during the run is stuck above the current price now, and they will sell into every attempt to climb back toward them. I stay away from those charts.
Your New Routine
Tomorrow morning, when you pull up yesterday’s runners, do more than rank them by percent gain.
For each name on your list, start by looking for a previous resistance level (a price the stock routinely gets rejected at).
Then walk through the three parts of the setup on the chart. If the stock traded above the level at some point, dipped back below it later in the session, and closed back above it by the bell, that name is a candidate for tomorrow.
If any part is missing, skip it.
Do that check on every runner tomorrow. Half of them come off the list right away.
But now you have a strategy for catching those Day 2 runners, instead of just sitting on your hands.
Stay Sharp,
Jack Kellogg
PS: My mentor Tim Sykes has been trading something the rest of the market ignores.
He hasn’t talked about it in public until now.
This week he’s laying out exactly what he’s found and how he trades it.
Sign up for the FREE webinar here.
*Past performance does not indicate future results