Hey traders,
Every October, something strange tends to happen in crypto.
The sector wakes up. Volatility returns. And tickers you haven’t looked at in months suddenly explode off the lows.
It’s why traders call it “Uptober” a seasonal pattern that’s become more than just a meme.
But what most traders miss is what happens outside the top coins.
When Bitcoin or Ethereum heats up, smaller stocks that move in tandem with crypto often start to follow, especially lower-float names that have lagged behind.
These aren’t always clean, obvious trades. You’ve got to dig. You’ve got to time them right. But when they move, they can move fast.
The key isn’t to guess where BTC is going next.
It’s to understand when crypto hype is bleeding into penny stock land, and how to find the tickers that are catching the tailwind before the crowd does.

Bitcoin runs first. Ethereum usually follows. Then, if the momentum is strong enough, you start seeing obscure penny stocks with weak crypto ties spike out of nowhere.
That’s the window we’re in right now.
At the start of the month, you could buy almost any breakout and it’d rip. Daily charts looked clean. Spikes followed through. Traders were eating.
But as always, that window starts to close.
Right now, we’re seeing a classic shift:
- Setups are thinning out
- Volume’s drying up
- More fakeouts, fewer follow-throughs
That doesn’t mean the opportunity is gone. It just means the edge has changed.
This is where most traders overstay their welcome, trying to force the same strategies even as the market dynamic breaks down, while the better move is to adjust. Scale back. Get more selective.
I’ve narrowed my focus to a few solid daily charts that are still showing potential, while keeping one eye on what the next theme could be.Bit Digital, Inc. (NASDAQ: BTBT)
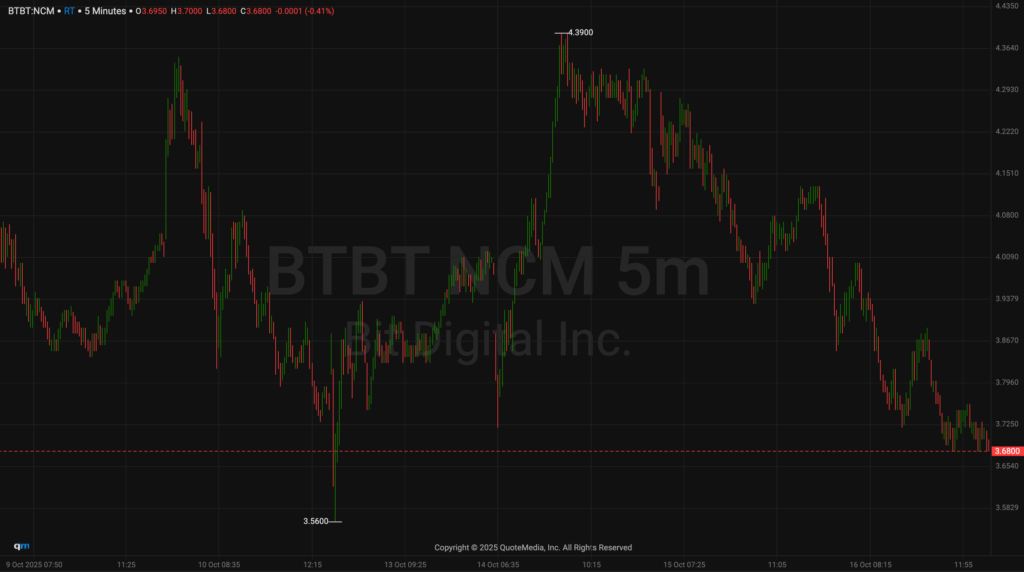
Still trades with heavy volume, and if Ethereum pushes, this could follow through hard. I’ve got $4.50 marked as the key level.
Surf Air Mobility Inc. (NYSE: SRFM)
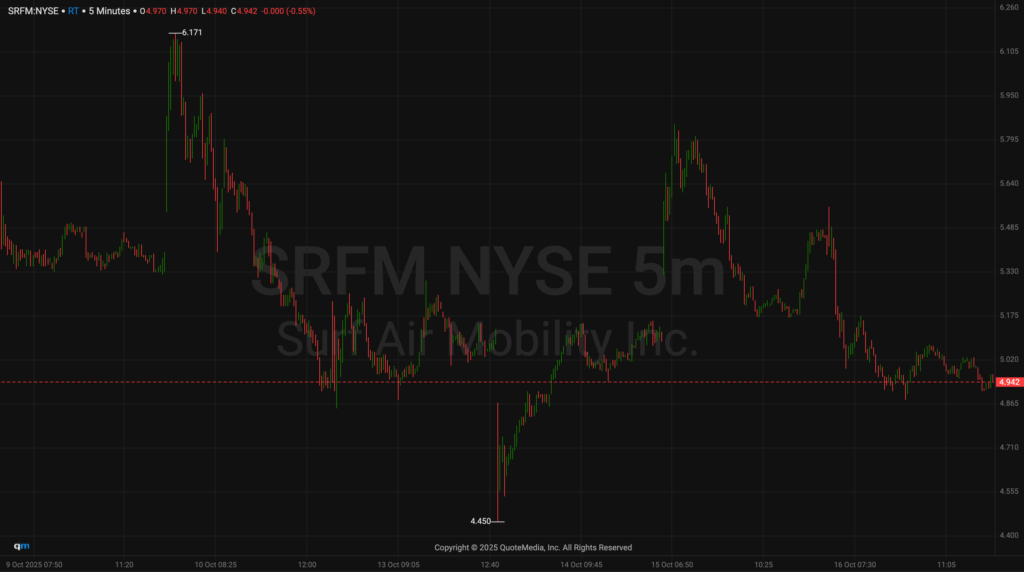
It’s building a beautiful base. I want to see it get tighter near $5.50–$6 before a real breakout setup triggers.
ESS Tech, Inc. (NYSE: GWH)
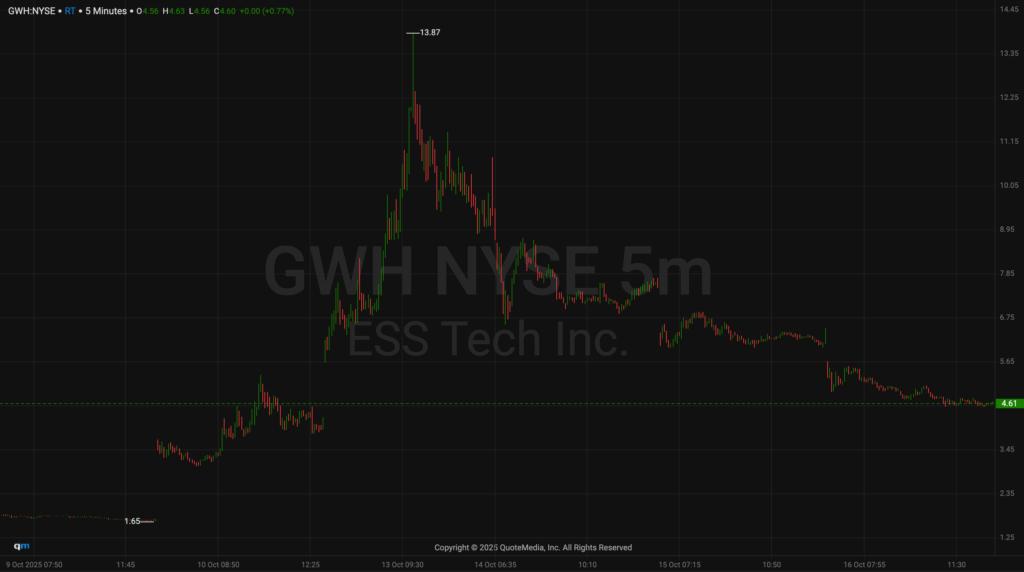
This one is a simple bounce watch: First green day potential after a decent fade.
The truth is, trades like these don’t show up randomly. They’re often early signs of the next rotation, and spotting that rotation is everything.
That’s why I created The Power Signal Indicator. It’s not just about alerts; it’s a live community of traders all watching the same market in real time, sharing insight, and adapting together.
There’s a chat built in, so when something starts moving or dying, you hear it from other active traders right away.
That real-time feedback loop has made a huge difference for how I time these shifts, especially in choppier markets like this one.
The best trades always start with clarity. Don’t wait for the crowd, train your eye, trust your prep, and stay ready.
Stay sharp,
Jack Kellogg