Hey Traders,
When I was just starting out, traders kept throwing around the terms “support” and “resistance” like they were just common sense.
I remember thinking, “OK … but what the heck does that actually mean?”
It sounded important but felt like a secret code.
Once I finally cracked it, everything started to make sense.
Support and resistance are like the floor and ceiling for a stock’s price.
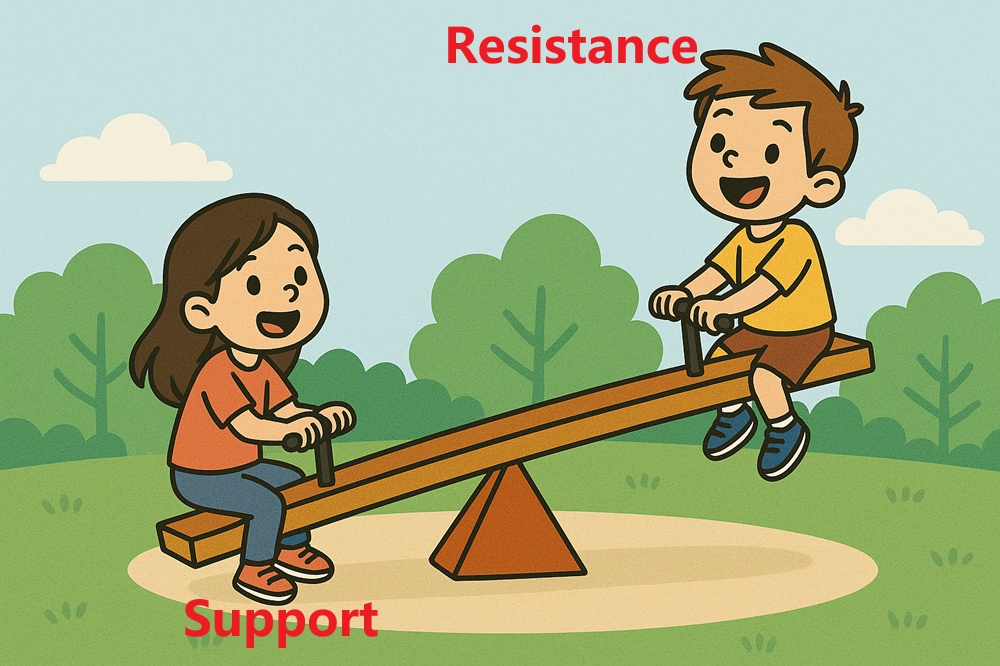
Support is the level where a stock price tends to stop falling. Buyers come in, demand picks up, and it bounces.
Resistance is where the stock has trouble going higher. Sellers step in, and the price often pulls back.
These levels form based on past price action, and they can be especially useful for deciding when to enter or exit a trade.
Here’s everything you need to know, in a nutshell.
Bookends of Stock Price
For example, let’s say a stock keeps bouncing off $2.50.
Every time it dips, buyers show up there.
That’s support.
On the flip side, if it keeps failing to break past $3.00, that’s resistance.
Knowing these levels helps me plan my trades better.
I can buy near support with a tight risk, and if the stock breaks resistance on volume, that’s a potential breakout.
The first thing to know is this: Support and resistance aren’t exact numbers — they’re more like zones.
A stock might bounce near $2.50, but maybe it’s $2.48 one time and $2.52 the next.
Same with resistance.
That’s why I always look at the chart and try to get a feel for the area where the stock reacts, not just a certain number.
I also like to look at intraday charts and daily charts to get the full picture.
Intraday can show me where the stock has been bouncing that day, while daily charts help me see longer-term levels.
If a stock breaks above a resistance level it hasn’t passed in months, that can attract even more buyers.
That’s when momentum kicks in.
When support breaks, it can lead to panic selling.
When resistance breaks, it can lead to a big spike.
That’s why these levels matter.
They’re where emotions tend to shift — fear and greed show up strongly at these points.
Groupthink Is Real
Because of all that, it’s important to look beyond the chart to crowd psychology.
In other words, where are people most likely to buy or sell? Where are they trapped?
When you start thinking that way, the chart begins to tell a story.
And as long as you proceed with caution, you can turn the story to your advantage.
Remember that just because something bounced before doesn’t mean it will again.
You have to consider the volume, the catalyst, and the overall market.
But if you keep watching these levels every day, you’ll start to get a feel for them.
Support and resistance are among the most basic tools in trading, but they’re also among the most powerful.
They help you stay patient, wait for your setups, and trade with a plan.
For me, that’s been one of the biggest keys to growing as a trader.
The more screen time you get, the more natural this becomes.
Just keep showing up, keep watching the price action, and keep learning.
That’s how I did it.
Stay sharp,
Jack