This one takes me right back to the start of my trading career.
1 scan I never miss.
It’s part of my daily preparation.
The crazy thing is, as a newb I was terrible at it.
It’s based on natural human instinct (think fear and greed)…
The best part is..
It’s two easy-to-understand technical analysis levels…
Why Support and Resistance Are Key
Understanding support and resistance levels is one of the key parts of my trading process.
In fact, I base most of my entry and exit decisions on support and resistance.
Long or short, I want to sell into key resistance.
And the opposite is true for support (I buy or cover near support).
It sounds simple, but you also have to be aware of yourself and your emotions (and avoid getting it turned around).
The Beginner’s Trap
As a beginner, all I was doing was chasing, chasing, chasing…
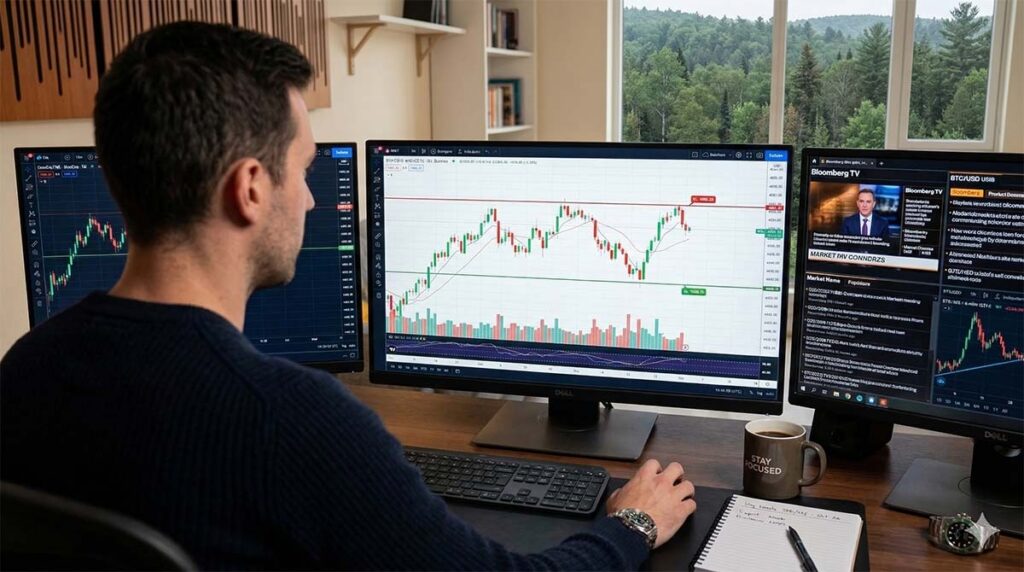
Image created by Google Gemini
I’d buy into resistance…
Then it would slam back down to support and I would sell.
The natural human instinct is to sell when support gets tested (because you’re scared).
On the other side, the natural instinct is to buy into resistance because you think it can break out.
That’s just greed talking.
When I traded this way, I was only winning 15-20% of my trades, guys.
When I got it, it was like a switch flipped.
Now, I love to buy into dips.
Here’s a super simple tip (I recommend this to all traders).
Draw Lines on Your Charts
I know that sounds straightforward (and basic).
But you wouldn’t believe how many new (and sometimes experienced) traders I meet who don’t do this.
It doesn’t have to be super complicated…
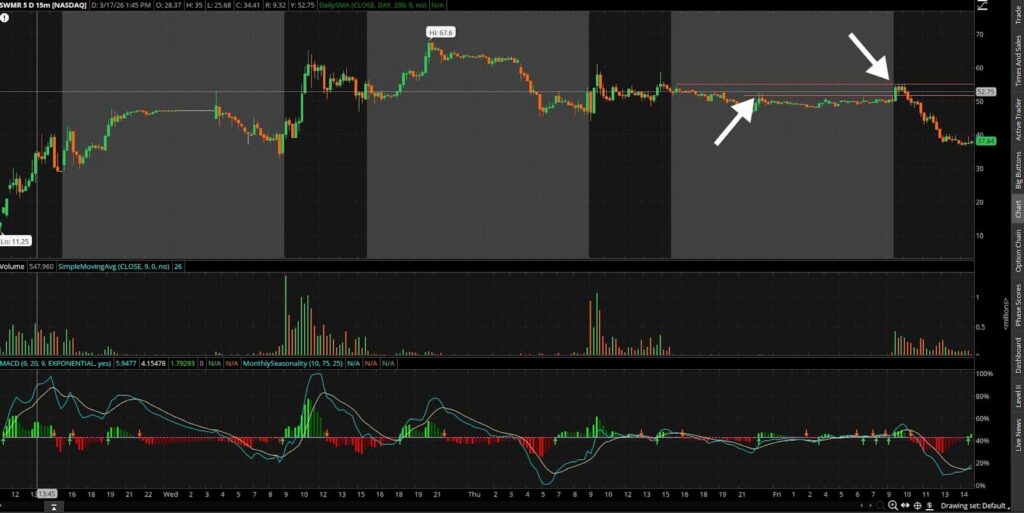
Source: thinkorswim SWMR 5-day, 15-min candle
As you see on the chart, I drew a couple of quick lines on this Swarmer, Inc. (NASDAQ: SWMR) chart just as an example.
To be clear, I usually have moving averages, trend lines, and even more support and resistance lines on my charts (this one was quick and dirty).
I just want you to see how easy it is to start making decisions based on simple technical analysis.
Here’s the most important lesson…
Buy Into Support… Sell Into Resistance
You will have a much better chance of making money.
If you chase, you’re much more likely to sell early (in the back of your mind you fear it might test support again).
If you buy at support, there’s room to let your thesis ride.
If support cracks… THEN you sell.
So, keep that in mind.
The Psychology of Support and Resistance
This helped me a lot when I figured it out.
A lot of people base their entire trade thesis on support and resistance.
That means some levels get crowded.
When everyone sees the same support level, it’s a lot less likely to hold (because everybody’s doing the same thing).
You DON’T want to be doing the exact same thing as everyone else.
So, look for your own support and resistance levels.
That said, there are also strong psychological levels (and you HAVE to pay attention to those)…
For sub-penny and true penny stocks, it might be 1-cent or 10-cents.
For listed stocks, it’s $1, $5, $10… and for bigger companies it could be $50 (or even $100).
All these whole number levels are key support and resistance.
That means a lot of people want to execute their positions there.
And THAT creates one of the best opportunities in all of trading…
The One Scan
I still look for stocks that are ready to cross one of these key levels every night when I run my scans (and again every morning).
And I’m excited about it right now because more low-priced stocks are coming into play.
Especially those passing the key $1 level.
StocksToTrade lead trainer Tim Bohen is an expert (maybe even THE expert) on the $1 dollar cross setup.
He says the $1 cross is so important because Wall Street cash, including hedge funds, pension funds, and index funds…
It’s all locked out until a stock crosses one dollar.
Tim Sykes and Tim Bohen are going live to talk about it.
Mark your calendar for Wednesday, March 25th, at 8pm ET.
I’ll be there.
I’m excited to know exactly how Bohen is taking advantage of this setup in 2026.
Have a great week.
– Jack Kellogg