There are two major events on the calendar today you need to know about. If you don’t, you could miss out on some great setups…or get run over.
Both are scheduled for this afternoon, and everything spills into tomorrow’s open. When that happens, I’ll be watching 3 specific small-cap signals.
Powell’s last press conference as Fed chair lands at 2:30 p.m. ET. His term ends May 15, and the next FOMC isn’t until June, so this is it.
His commentary almost always moves the market. And with this being his last opportunity to speak on this stage, his words may have more impact than usual.
Then Microsoft, Google, Meta, and Amazon all report earnings after the bell. These four prints will tell the market whether these companies’ extreme CapEx spending is showing up in revenue (or just in expense lines).
Meanwhile, small caps have been going up. And the first hour of trading tomorrow will tell us whether they keep going or the run is done.
If you wait until 10 a.m. to figure that out, the move will be over before you place a trade.
1. The Volume
First thing I check: IWM volume against its 20-day average.
If IWM is running 40%+ volume above average, institutions are repositioning. Direction matters less than the fact that volume shows up. It means the move is real.
If volume is flat or below average, that means the earnings prints didn’t change the small-cap thesis.
I’ll also check the names that led the run. If IWM volume is up, but the leaders are quiet, the bid is broadening to fresh names.
If the leaders are spiking, it’s a continuation. Volume is one of my four core indicators for a reason. No volume, no follow-through.
2. The First-Hour Price Behavior
How small caps trade in the first 60 minutes tells me almost everything.
If IWM gaps up and holds above the opening 15-minute range, that’s continuation. The prints were good enough, or rotation-friendly enough, that small caps are getting the bid. Trend intact.
If it gaps up and rolls over by 9:45 or 10? That’s a failed morning spike. The initial reaction was a knee-jerk, and the smart money is fading it. Big red flag for the run.
Gap down? The prints pulled money back into megacaps (and the rotation is on pause).
Tomorrow morning, I want to know where the small-cap names that rallied into today are trading versus their daily VWAP.
Above VWAP means buyers are in control. Below VWAP means sellers are in control.
VWAP is my primary intraday indicator. It keeps me from being a chaser.
3. The 52-week High
This is the simplest signal of the three.
One line on the chart, above or below:
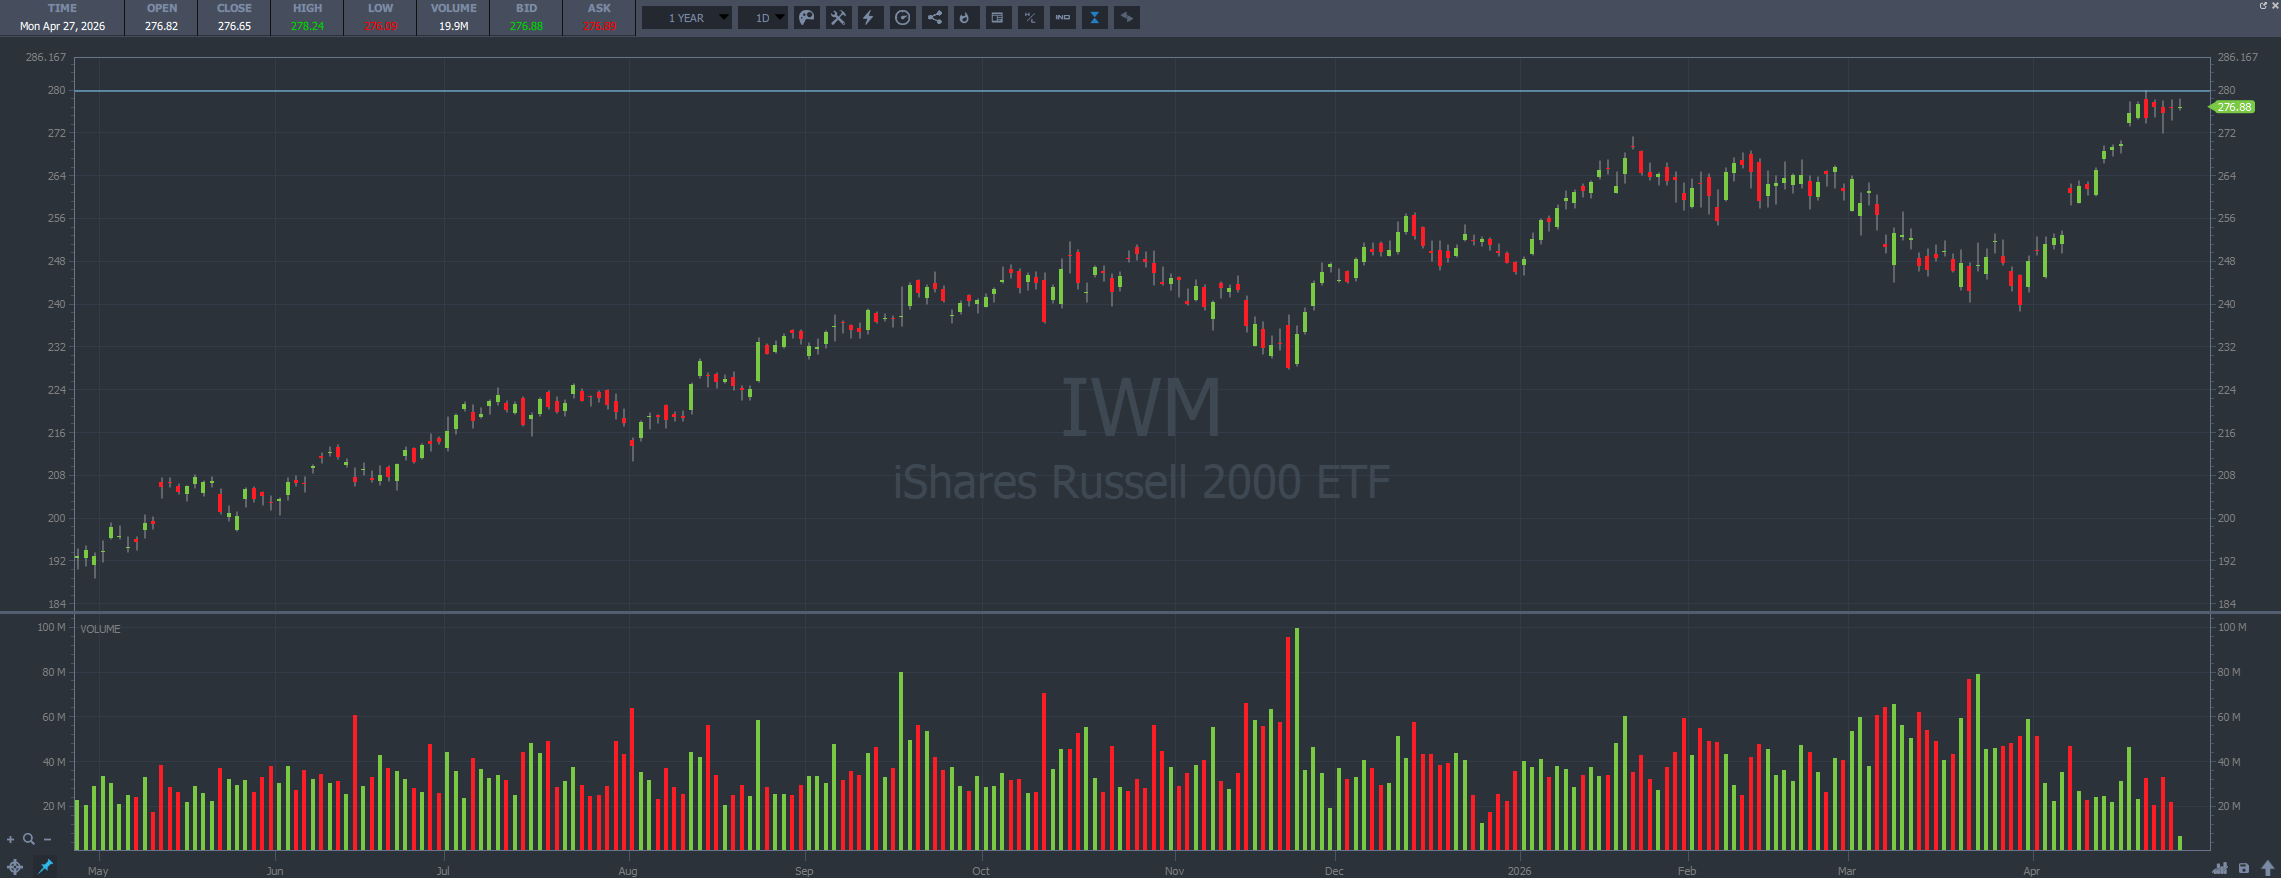
IWM closed Friday at $276.65, sitting just under the 52-week high of $279.79 set the week before. That’s the level.
If IWM clears $279.79 and holds tomorrow morning, the small-cap run is intact, and the chart is telling you to stay long the rotation.
If it rejects the high and rolls back through $276, the rotation is showing signs of reversing.
Watch for a follow-through break of last week’s lows after that.
Support and resistance are the floor and ceiling.
What If None Of Them Work?
Volume flat, first hour choppy, VWAP mixed, IWM just sitting between $276 and $279?
That is a signal. It means the prints didn’t change much. In that case, I’ll treat tomorrow like any other morning.
But if there’s a big post-earnings move, these three signals tell you how to respond.
Stay sharp,
— Jack Kellogg
Past performance does not indicate future results