

There are a million indicators you can draw on your daily charts.
But you can’t use more than a few at a time, or your head will explode trying to make sense of it all.
Smart traders use Trade Signals
I’ve seen guys with charts that look like pieces of modern art…

EMAS, VWAP, float rotation…All that stuff is important.
But they’re all designed to try and find out the same thing:
Who is winning the battle between the buyers and sellers?
Sometimes the answer is not easy to see. And that’s when traders use multiple indicators to try and find out.
But every week there are setups that don’t require any of that complicated stuff…
Trust me..
You’re making it WAY too complicated.
Let’s just look at how just this ONE INDICATOR is often all you need to make smart trades.
Yesterday’s High
When you pull up a stock that just ran, the previous day’s high is the most important level on the chart.
Above that level, everybody who bought the top yesterday is whole again. Under that level, they’re all underwater.
Which is why the first thing I look at the next morning is whether the stock can take that high out.
And you usually have your answer in the first five minutes.
I’ve got 3 names I’ve been watching that demonstrate exactly how to use this indicator.
bioAffinity Technologies, Inc. (NASDAQ: BIAF)
BIAF cleared Tuesday’s high inside the opening bar on Wednesday and never printed a low back beneath it.
Tuesday’s high was $8.60. That price is the trigger, and by the time Wednesday’s opening bar finished the stock was already at $9.38.
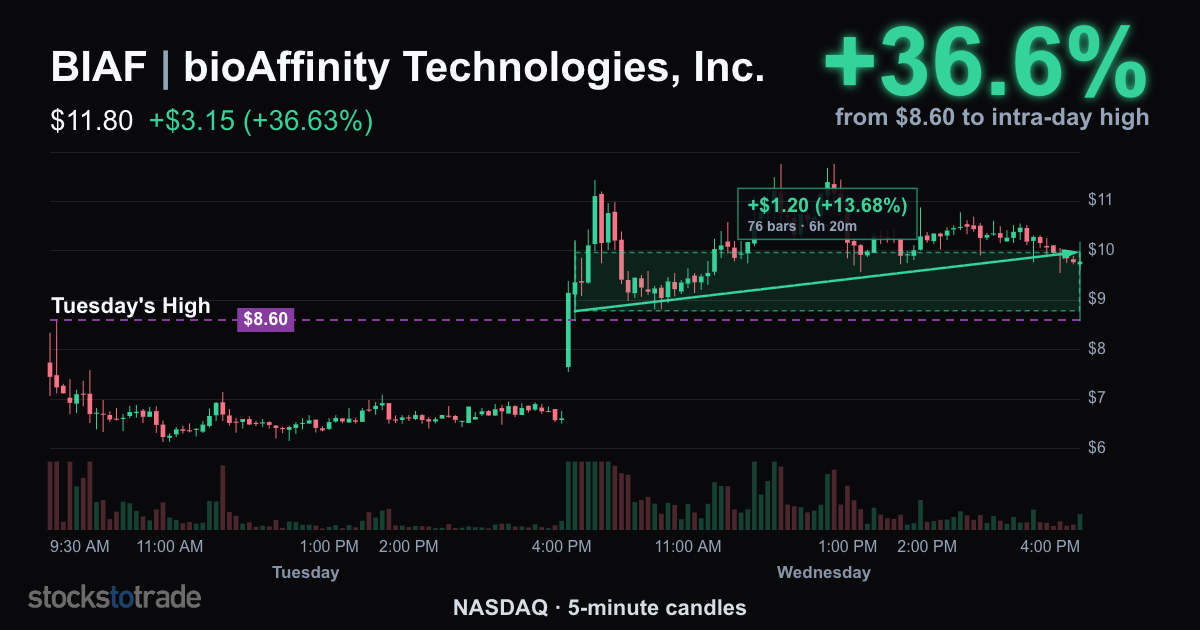
The stock ran over 36% from the trigger to the intra-day high at noon on Wednesday.
It finished 17% under the high it made at lunchtime, still up over 13% from the $8.60 level.
Buy the same stock at $9.38 and you finished the day up less than 4%.
Picard Medical, Inc. (NYSE American: PMI)
PMI ran 59.8% on Monday the 24th and set its high at $5.35.
Then Tuesday it opened at $5.87, already 10% above the line.
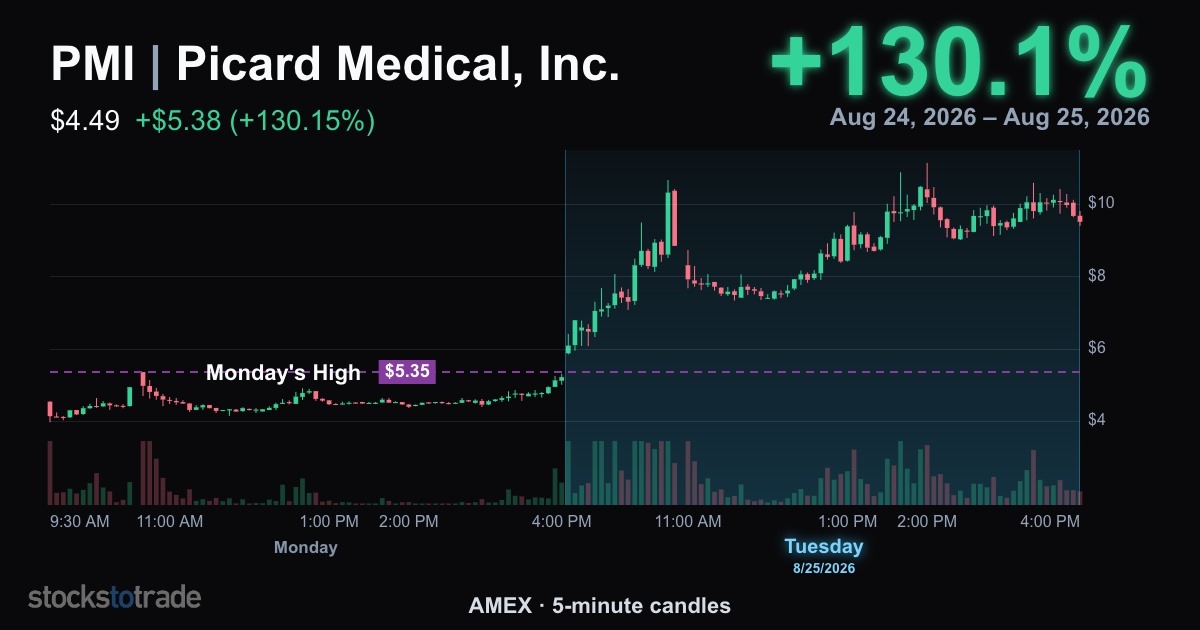
Paying up worked. PMI ran to $11.13 and closed at $9.55, 78.5% above Monday’s high.
Wednesday, the test was Tuesday’s high of $11.13, and the stock never got near it.
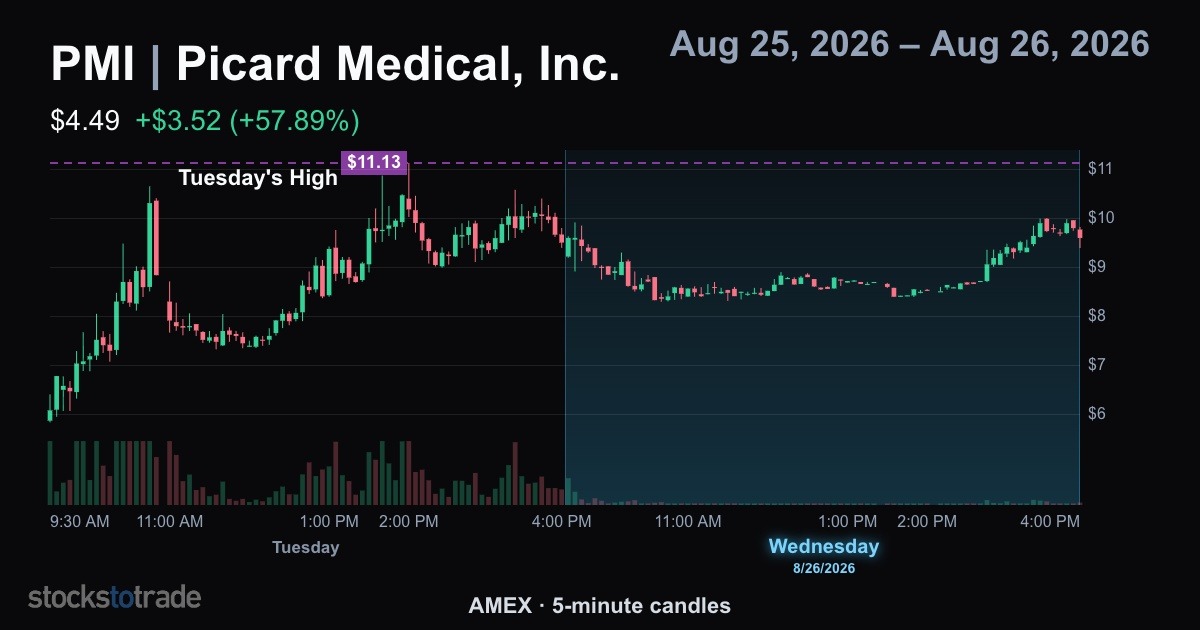
It still closed green that day at $9.80. But the run was over, and the next session took it to $9.09.
Wetour Robotics Limited (NASDAQ: WETO)
WETO ran to $14.00 on Monday, then closed that same session under $5.50.
Its best price all day Tuesday came in the first five minutes, almost 40% under the line.
Wednesday, the same thing happened again.
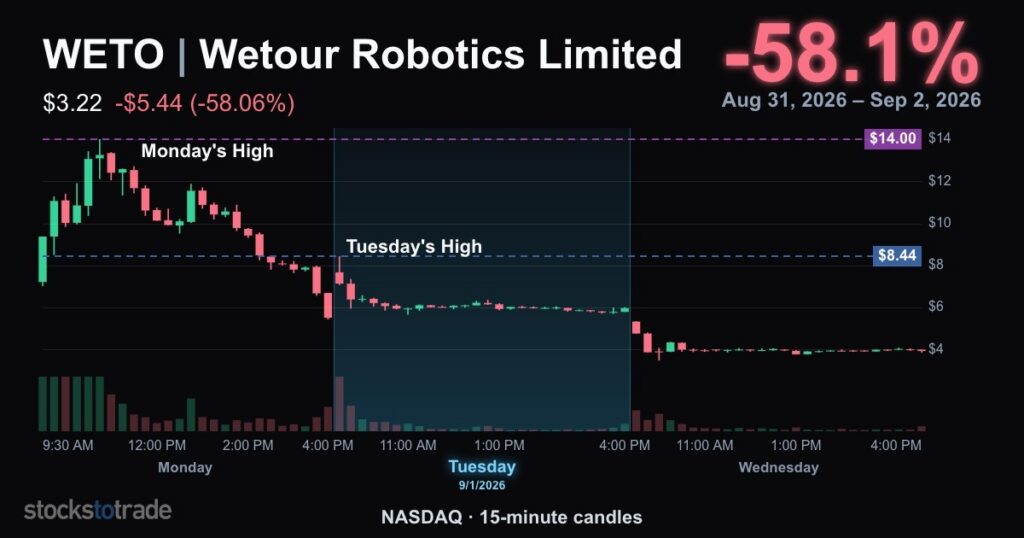
Buying either one of those opens and holding to the bell lost you 23% on Tuesday and 26% on Wednesday.
The bar got lower too. Tuesday it had to clear $14.00. Wednesday it only had to clear $8.44.
It still couldn’t, because the people who could have cleared it were leaving. Volume went 42.2 million on Monday, 14.6 million on Tuesday, 6.3 million on Wednesday.
If a name ran on huge volume and is now trading a fraction of it, the people who made the move have gone home, and the high they left behind is going to sit there.
So tonight, pull up whatever ran today and mark yesterday’s high on the chart.
The next session you’ll know inside five minutes. If it goes through and holds, you’ve got something to work with, and the closer to that line you get in, the more of the move you keep.
If it can’t get there, there’s nothing to buy.
If you want the setups without all the homework, sign up for Trade Signals today.
Stay Sharp,
Jack Kellogg
*Past performance does not indicate future results