You probably have money sitting in a retirement fund right now. Keyword: sitting.
In January 2024, I had $10,000 in a Roth IRA. But instead of letting it “sit there,” I took that account to over $4 million in just over a year using one of my most reliable patterns.
The first green day.

One of my biggest winners on this pattern was SERV. Over $419,000 on a single trade.* SERV had been fading for weeks. Then it printed a green day with real volume.
I bought into the close, held overnight, and sold into the next morning’s strength.
I had another one on FNMA the same year for over $405,000.* Same pattern, same execution.
If a trader mastered just this one pattern and nothing else, I’m fairly confident they could outperform a lot of other folks.
But it only works on a specific kind of stock.
The Pattern
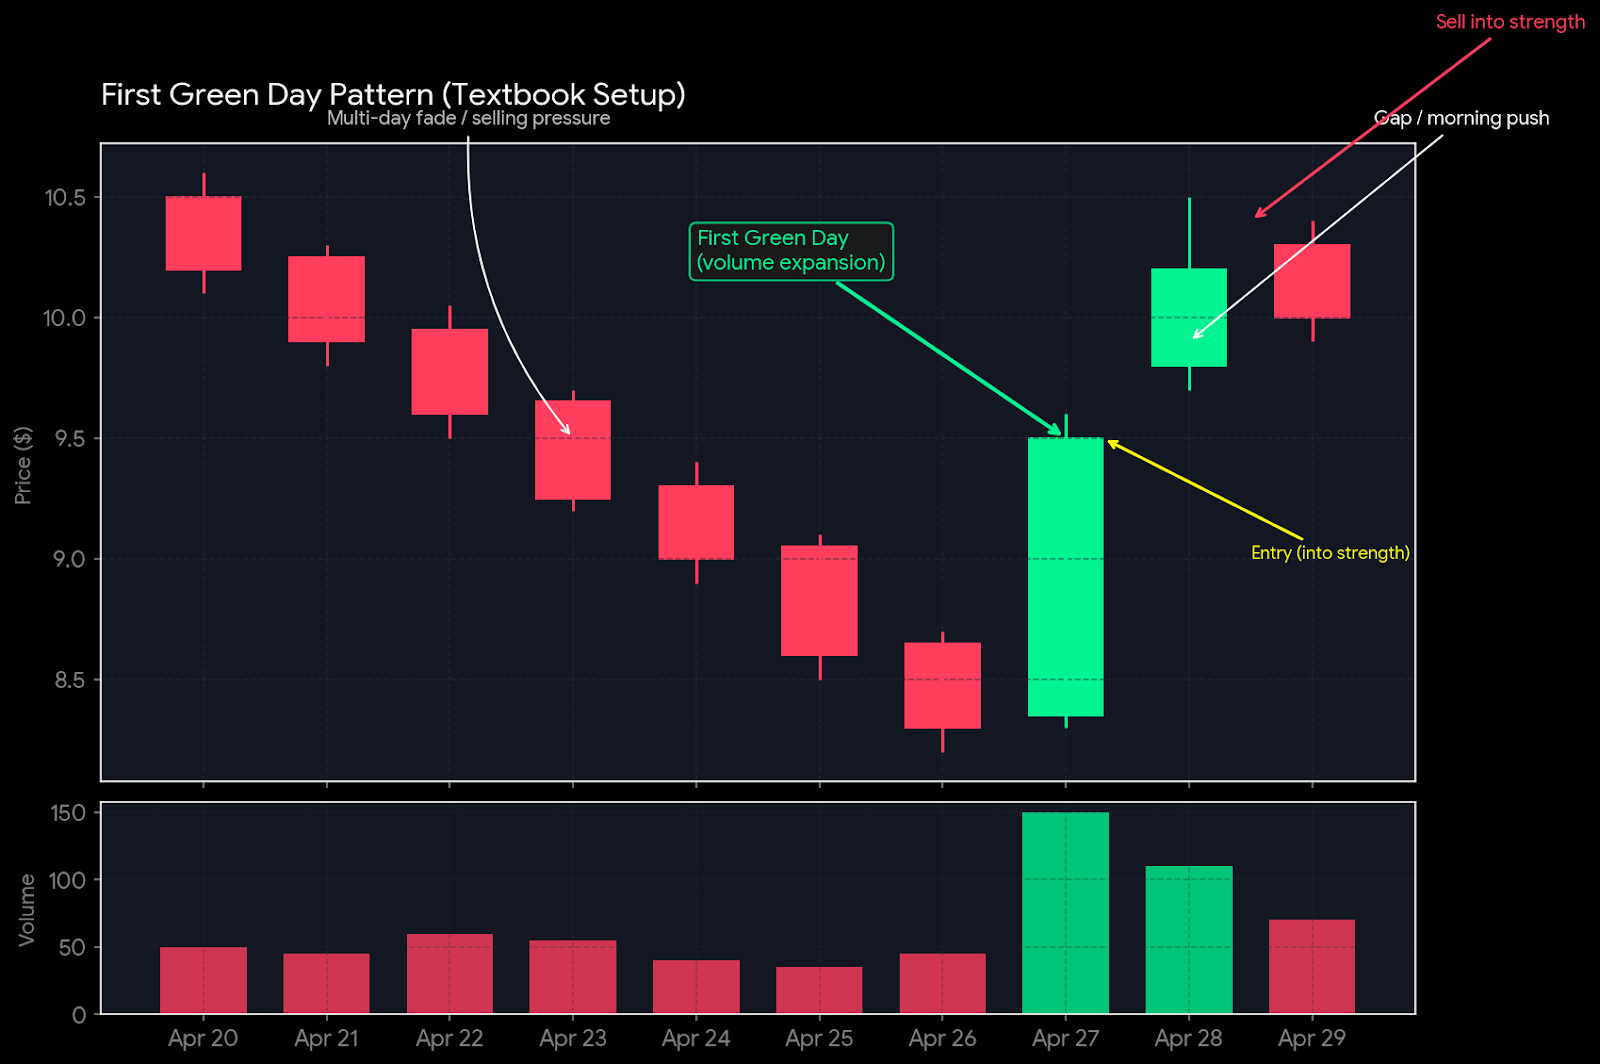
A first green day is what it sounds like. A stock has been fading or sitting flat for a stretch. Three or four red days, a week of sideways action, sometimes longer. Then one day it closes green with real volume.
The green candle is the signal.
The reason it works comes down to who’s left in the stock. After three or four red days, sellers aren’t pressing the stock down anymore.
Anyone who wanted out has already gotten out. The supply pressure is gone. When buyers step in for the first time in days, there’s nothing overhead to stop them.
OTCs don’t trade pre-market. So when an OTC prints a first green day and closes strong, anyone who saw it after hours has to wait until 9:30 the next morning to act.
Traders place those orders at the open, all at once. That’s the cleanest version of this setup.
The pattern shows up on NASDAQ names as well, but the edge is smaller.
Pre-market trading absorbs some of the overnight demand before the open, so part of the gap is priced in by 9:30. The setup still works when the conditions are right.
SERV was on NASDAQ. I just need the chart shape to be cleaner before I take it on a listed name.
The Setup
I want a stock that’s been fading or basing for at least a few days, with a green day on real volume that closes near the high. The longer the fade, the better.
Former supernovas that have cooled off are my favorite version. Closing weak kills the trade. The whole thesis is that buyers are in control by the close.
If the stock fades into the close, the late-day sellers don’t believe in it (and neither do I).
The Entry
Last hour of trading, around 3:00 to 3:45 pm Eastern. By then, I can see whether the green day is going to hold into the close. If it’s holding, I size in.
The Exit
Next morning. I’m looking for a 10% to 15% follow-through on the gap or in the first hour. If it gaps up, I sell into the gap. If it opens flat and runs, I sell into the run. I’m out by lunchtime, usually a lot earlier.
The Stop
The breakout level on the green day candle, or the day’s low if I got in lower. Risk is a few cents on a sub-dollar stock. Upside is multiples of that. If the stock breaks back below my entry on volume, I’m out. No waiting to see if it comes back.
The Catalyst
A real news catalyst is a bonus. The pattern works without it, just not as far. Sector heat is the same way. Either one extends the move.
SERV and FNMA were two of my biggest first green day plays last year. There were a lot of others.
My account started with $10,000. The pattern that built it is one any disciplined trader can learn. And every dollar of that growth is going to compound, tax-free, for the next 30 years.
Stay sharp,
Jack Kellogg
P.S. The first green day is one of the patterns I leaned on most. But it’s not the only one.
See the full playbook I used to take that Roth IRA from $10,000 to $4 million.
*Past performance does not indicate future results, Not typical.